-
Key Takeaways
-
Understanding Latitude and Longitude
-
Airports and Airport Information
- Airport Name
- Elevation
- CTAF
- ASOS Frequency
- UNICOM Frequency
- Longest Runway Length
-
Terrain and Obstacles on a Sectional Chart
-
Controlled vs. Uncontrolled vs. Special Use Airspace
-
Controlled Airspace
- Class A
- Class B
- Class C
- Class D
- Class E
-
Uncontrolled Airspace
-
Special Use Airspace
- Prohibited Areas
- Restricted Areas
- Warning Areas
- Alert Areas
- Military Operation Areas (MOA)
- Military Training Route (MTR)
- Temporary Flight Restriction
-
Frequently Asked Questions
-
Conclusion
Last updated:
Being able to read sectional charts is one of the more essential skills that a drone pilot should have. By developing this skill, a drone pilot gets to understand the nature of airspace hazards, topography, airport data, and controlled airspace.
For those who are looking to earn a Part 107 remote pilot certificate, reading and understanding sectional charts make up a significant chunk of the knowledge test you’ll need to pass to be certified.
How does one go about learning how to read a sectional chart? Starting with this easy-to-understand guide that we prepared would be a great idea.
There are a lot of things to learn about sectional charts, and you may get overwhelmed at first, but we’ll take it slowly and go over everything one at a time.
Key Takeaways
- Sectional charts are essential for drone pilots to understand airspace, terrain, and hazards.
- Learning latitude, longitude, and quadrants is the foundation for reading sectional charts.
- Airport symbols and data reveal runway types, elevations, and radio frequencies.
- Knowing airspace types and special use areas helps pilots avoid violations and fly safely.

Free Private Pilot Study Sheet
Grab a printable PDF that highlights must-know PPL topics for the written test and checkride.
- Airspace at-a-glance.
- Key regs & V-speeds.
- Weather quick cues.
- Pattern and radio calls.
Understanding Latitude and Longitude
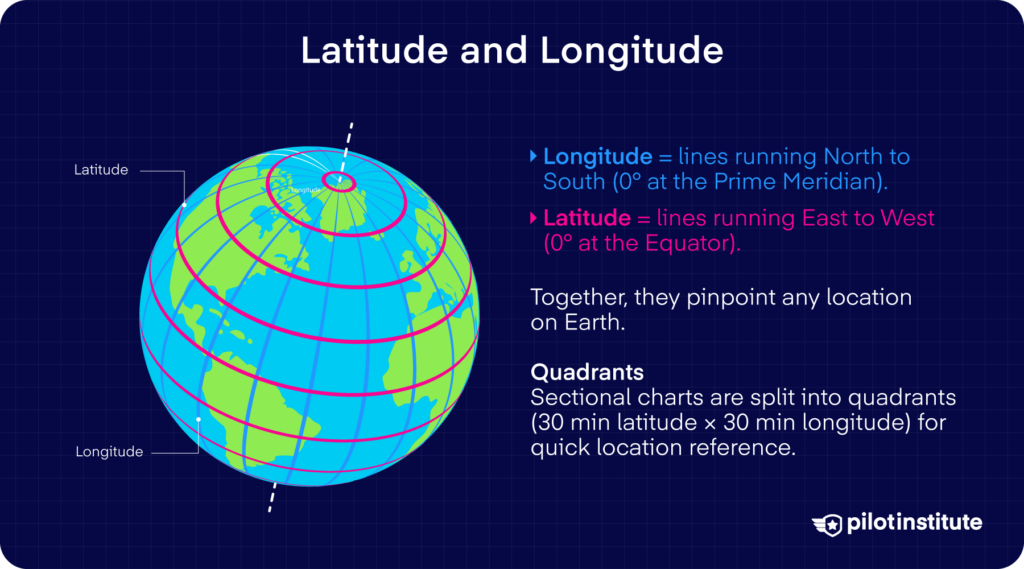
Before we jump into sectional charts, let’s go over the basics of reading a map. The location of every point on the planet can be determined by latitude and longitude coordinates as defined by an imaginary grid pattern.
To easily remember the difference between the latitude and longitude, we must first define the location of the equator and the prime meridian.
The prime meridian is a line that runs from the North Pole to the South Pole and passes through Greenwich, England. This also acts as the “zero longitude” and is the basis for the measurement of all other longitudes, or lines that run North to South.
Lying perpendicular to the prime meridian is the equator. It is at the point that lies equidistant from the North and South poles and is effectively the “zero latitude”. All other latitude lines are parallel to the equator and are measured based on their relative locations.
There are two major ways in which latitude and longitude coordinates are expressed:
The more historical method uses a system of degrees, minutes (1 degree = 60 minutes), and seconds (1 minute = 60 seconds).
By default, most modern GPS systems express latitudes and longitudes using decimal notation. However, swapping between the two methods can be easily done.
Every location in the world can be pinpointed by a pair of latitude and longitude readings. This is one of the most basic skills of map reading and is something that you will need to develop before you can move on to more advanced topics.
For better delineation of smaller areas in a sectional chart, the whole map is separated into quadrants. A quadrant is an area defined by a boundary within 30 minutes of latitude and 30 minutes of longitude. Quadrant identifiers serve as quick references when pilots are indicating specific but broad areas in the sectional charts.
Airports and Airport Information
Airports can be found all over sectional charts and are some of the most important points of interest. There are also different types of airports and they can be distinguished in sectional charts according to whether they have a control tower, a hard-surfaced runway, or if they have fuel availability.
The symbols representing airports in sectional charts can also be useful in letting drone pilots know which radio frequency to monitor for air traffic updates related to particular airports.
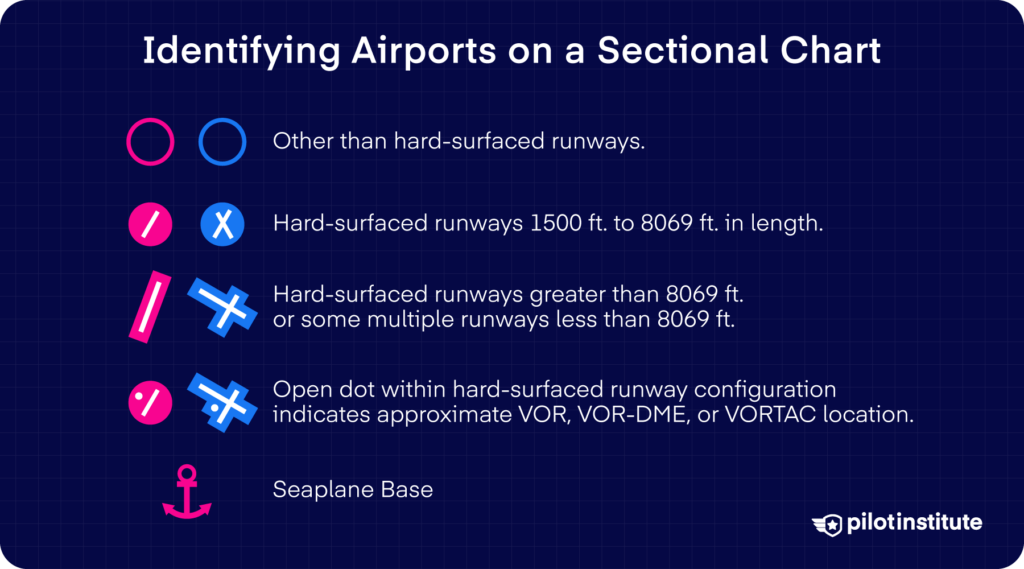
To start, the most obvious distinction to make is between airports with control towers (blue symbols) and airports with no control towers (magenta symbols). For public-use airports, the following list of symbols can be used as a reference:
| Public Use Airports |  | Airport with a hard-surfaced runway greater than 8069’ or with multiple runways less than 8069’. |
 | Airport with a hard-surfaced runway between 1500’ and 8069’. | |
 | An airport that does not have a hard-surfaced runway. | |
 | Seaplane base. | |
 | Tick marks around standard airport symbols mean that fuel is available in the airport Monday through Friday from 10 AM to 4 PM. |
In contrast, military airports can be easily identified as they are represented by abbreviations such as AAF (Army Air Field), NAS (Naval Air Station), and NAV (Naval Air Facility), among others.
As for other information on a specific airport, you will need to look at the series of letters and numbers that accompany each airport symbol. The best way to demonstrate this is through an example.
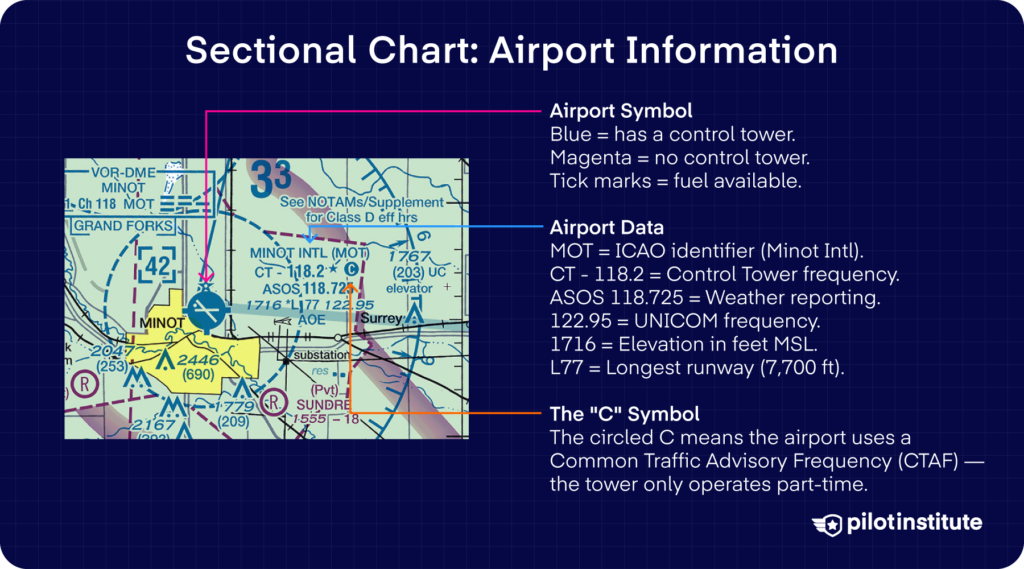
From what we know so far, we can infer that the airport represented by the symbol has a control tower, a hard-surfaced runway shorter than 8069’, and provides fuel service. The rest of the relevant information can be derived from the text located immediately at the right of the symbol.
Airport Name
Each airport is represented by an abbreviation agreed upon by the International Civil Aviation Organization (ICAO). For our example, the 3-letter identifier is MOT, which stands for the Minot International Airport.
Elevation
The airport is located at an elevation of 1716 feet MSL (above mean sea level). This has implications for the scope of controlled airspace surrounding the airport, as we shall see later.
CTAF
The dark blue circle with a ‘C’ means that the airport uses the Common Traffic Advisory Frequency (CTAF), which allows passing pilots to self-announce their location and intention.
This implies that, although the airport has a control tower, it only operates part-time. Moreover, the frequency that drone pilots need to monitor to hear self-announcing pilots is 118.2 MHz.
ASOS Frequency
The symbol indicates that the airport’s ASOS frequency is 118.725. ASOS stands for Automated Surface Observing System, a fairly basic but robust system that automatically reports weather info such as barometric pressure, wind speed and direction, visibility, and precipitation.
UNICOM Frequency
As we’ve mentioned, the control tower of this airport only operates part-time, thus the need to have CTAF. When the tower is active, however, it uses the UNICOM frequency of 122.95. When scanning for communications, it would be best to monitor both the airport’s UNICOM and CTAF channels.
Longest Runway Length
The longest runway of the Minot International Airport is 7700 feet as indicated by ‘77’ in the symbol, expressed in hundreds of feet.
Terrain and Obstacles on a Sectional Chart
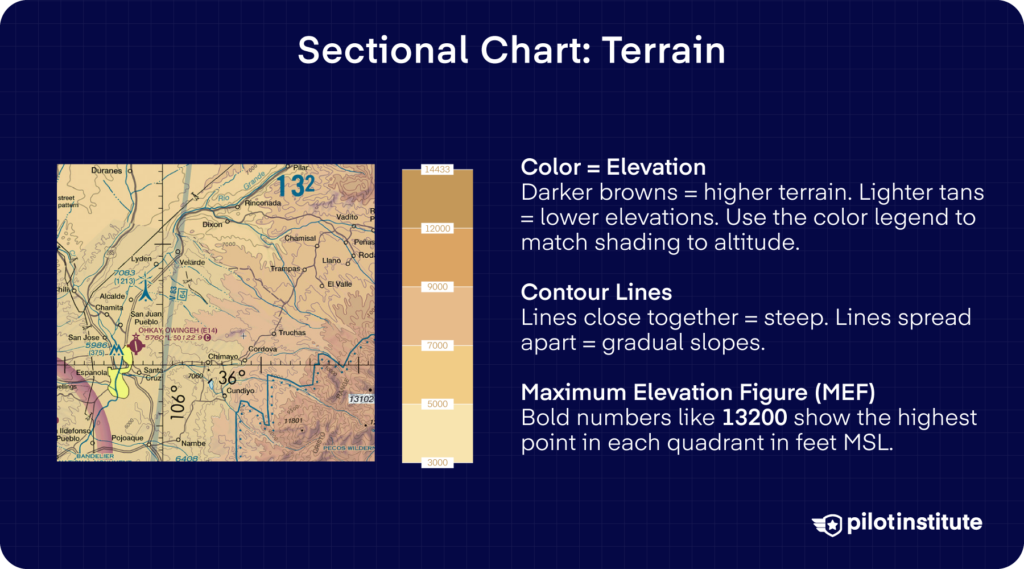
Aside from points of interest, sectional charts also provide guidance for pilots to avoid obstacles and to fly above constantly changing terrain. The most prevalent indicators of the terrain are contour lines or the shaded relief map, either of which may act as the base map for the sectional chart.
| Terrain (Contour Lines) | 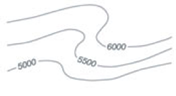 | Contour lines connect points of equal elevation. The graduations between the lines may vary based on the resolution of the map, but intervals of 50 to 250 feet are common. |
| Terrain (Shaded Relief) |  | Shaded relief maps are a way of visually representing the terrain of the map by allowing the viewer to see the terrain features as if there is a light source from the north-west. |
With a bit of practice, it only takes a cursory glance at a map to identify areas of low and high elevation as well as significant geological features such as mountains, rivers, and valleys.
Beyond visual terrain indicators, a sectional chart also contains symbols and figures that pilots can use to adjust their flight parameters and trajectories.
One of the most important is the Maximum Elevation Figure (MEF), a number found in each quadrant of the sectional chart. The MEF of a quadrant represents the highest elevation of any terrain or man-made features in the quadrant.
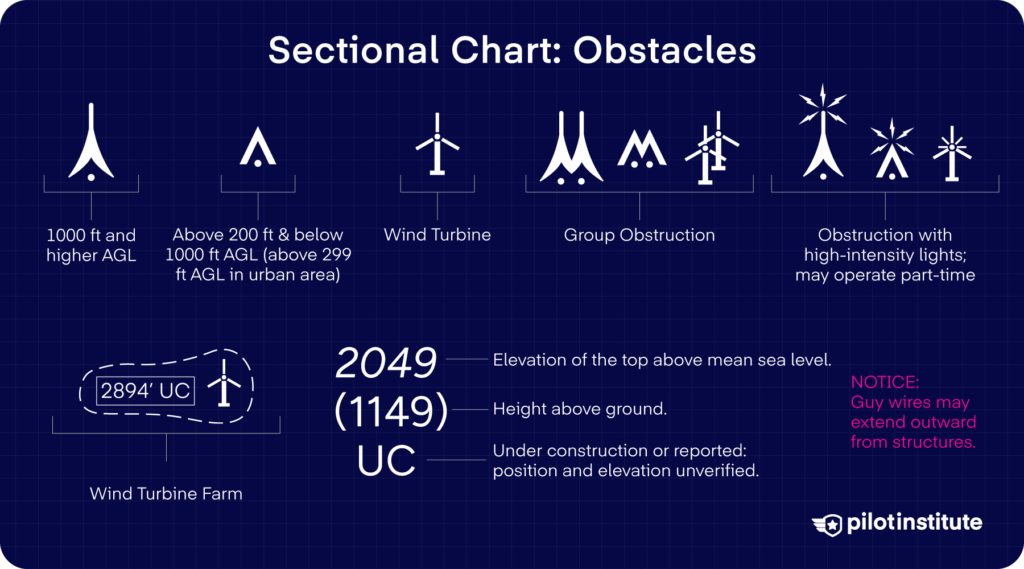
There are also several other symbols found in sectional charts to represent various types of obstacles, as summarized below:
| Maximum Elevation Figure (MEF) |  | The MEF represents the highest elevation of any terrain or man-made features in a quadrant. Its figures are rounded up to the nearest hundreds are expressed in hundreds of feet. For this example, the figure refers to 12,500 feet elevation. |
| Man-made obstacles less than 1000’ AGL. |  | The FAA maintains a database of man-made vertical features that may need to be considered by aircraft pilots. This database is updated as necessary and each obstacle is evaluated before being added to sectional charts. |
| Man-made obstacles greater than or equal to 1000’ AGL. |  | |
| Group Obstacles |  | When there are multiple obstacles in the area that cannot be identified individually, they are instead categorized as a group obstacle. Only the height of the highest obstacle is indicated in the symbol and is expressed in both AGL and MSL units. |
| Obstacle under construction. |  | Obstacles marked ‘UC’ or ‘Under Construction’ are those whose position and elevation cannot be determined or verified yet. |
| Checkpoint |  | Obstacles denoted by a black and white symbol are those are used by the FAA as checkpoints. |
| Lighted Obstacles | 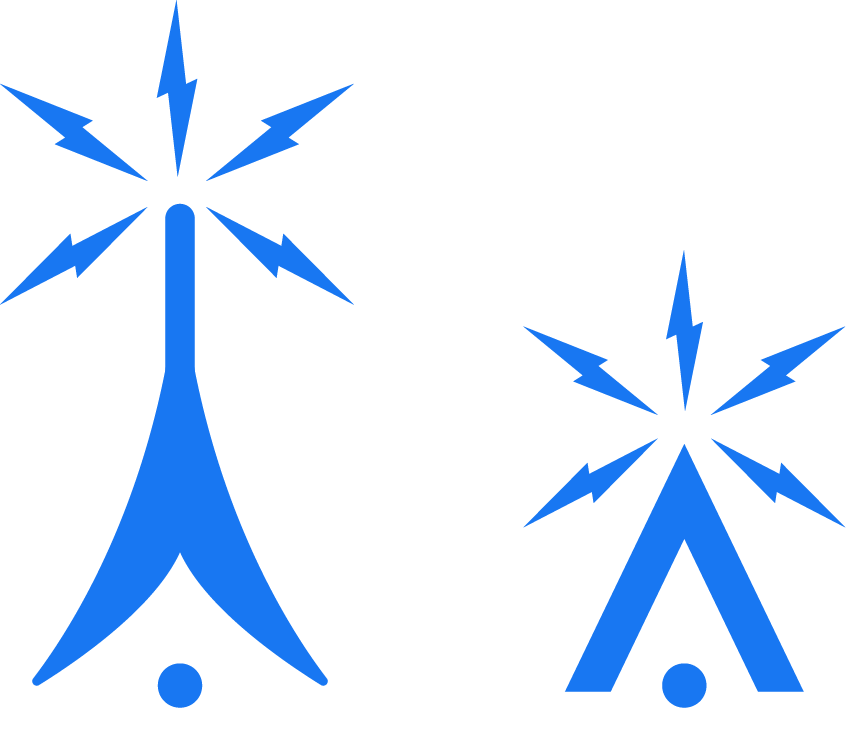 | Lighted obstacles are those that have high-intensity and strobing lights. |
Controlled vs. Uncontrolled vs. Special Use Airspace
Once you’ve learned how to locate places on a map using their coordinates, it’s time to move on to the broadest distinction of airspace types in sectional charts. Each airspace type is represented in sectional charts by a specific symbol, and we’ll go over these symbols one by one.
We’ll look at the sub-classifications for each category, but for now, let’s define the distinction between controlled, uncontrolled, and special use airspace.
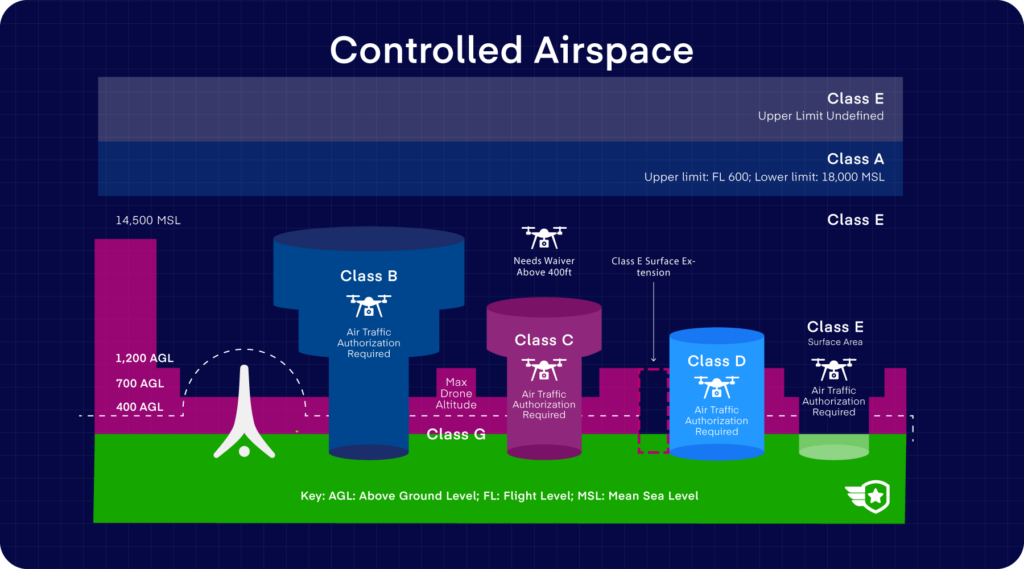
Controlled airspace refers to the airspace where air traffic control (ATC) services are provided. In simpler terms, you may assume that the airspace immediately surrounding any airport is considered controlled airspace.
Drone flight in controlled airspace is normally restricted because of the high volume of air traffic, but certain provisions have been put in place to allow it, subject to certain conditions. Controlled airspace has five sub-categories from Class A to Class E.
Uncontrolled airspace, also called Class G airspace, refers to airspace where there is no ATC regulation service due to low air traffic volume. Drone flight is generally allowed in uncontrolled airspace, as is any type of flight under VFR rules.
Special use airspace refers to an area where there may be air traffic restrictions because of various reasons that may not be directly related to normal air traffic activity. The level of flight restrictions may also vary and is always in the context of the reason for declaring special use airspace.
These reasons may include military training activities, artillery testing, VIP movement, air shows, natural disasters, or major sports events that can draw huge crowds.
Controlled Airspace
For the most part, controlled airspace is a simple matter because they remain in fixed positions and have more or less permanent geometries. As a drone pilot, the first thing you need to know about controlled airspace is the fact that you can’t fly in these areas without securing airspace authorization first.
Nowadays, this is done through the LAANC system – an automated electronic authorization request system developed by the FAA that allows drone pilots to receive replies to their requests almost instantaneously.
The LAANC system can be accessed through many of the common drone flight planning apps like KittyHawk and Airmap. The privilege is now available to both licensed and commercial drone pilots.
Part of requesting for airspace authorization is knowing exactly which type of controlled airspace you are in. These are the five different types:
Class A
Sectional Chart Representation: Not shown
Class A airspace exists between the range of 18,000 feet and 60,000 feet. This airspace is typically used by commercial airlines for long-haul flights. Since drones likely aren’t capable of reaching these altitudes, a drone pilot need not be concerned with Class A airspace
Class B
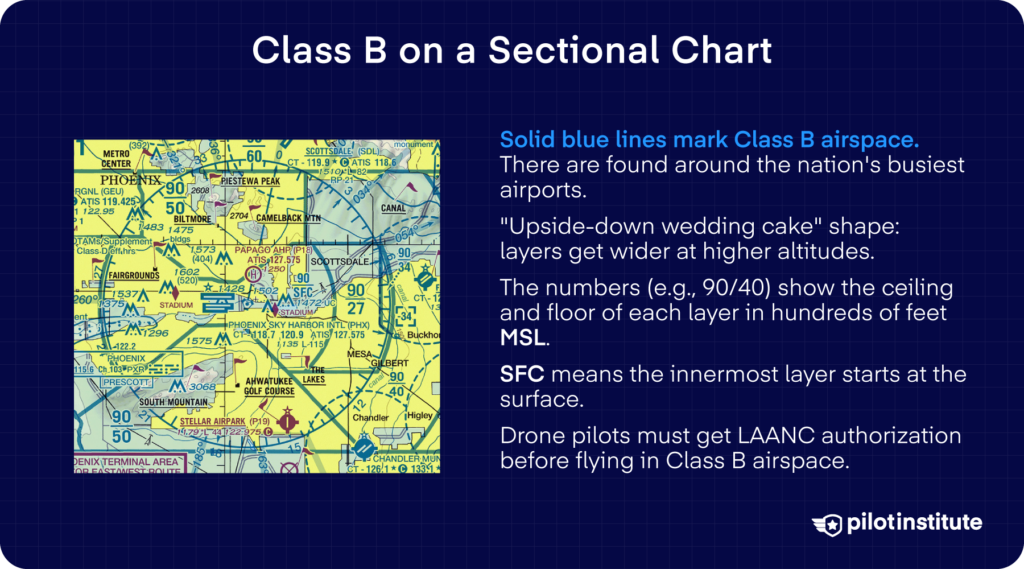
Sectional Chart Representation: Solid blue line.
Class B airspace is controlled airspace that surrounds the country’s busiest airports including major air travel hubs in big cities. As these airports have some of the highest air traffic volumes in the whole of national airspace, you an expect Class B airspace to also have the largest extent.
The geometry of Class B airspace can vary from one airport to the next but they typically form an “upside-down cake” shape where the widest layers are at the highest altitudes. To better illustrate this concept, let’s look at the sectional chart for the Phoenix Sky Harbor International Airport (KPHX):
As you may notice from the picture, several solid blue lines surround the KPHX airport, each with a unique shape.
Each of the bounded regions is also labeled with a number, and this number defines the altitude base and ceiling of the patch of Class B airspace.
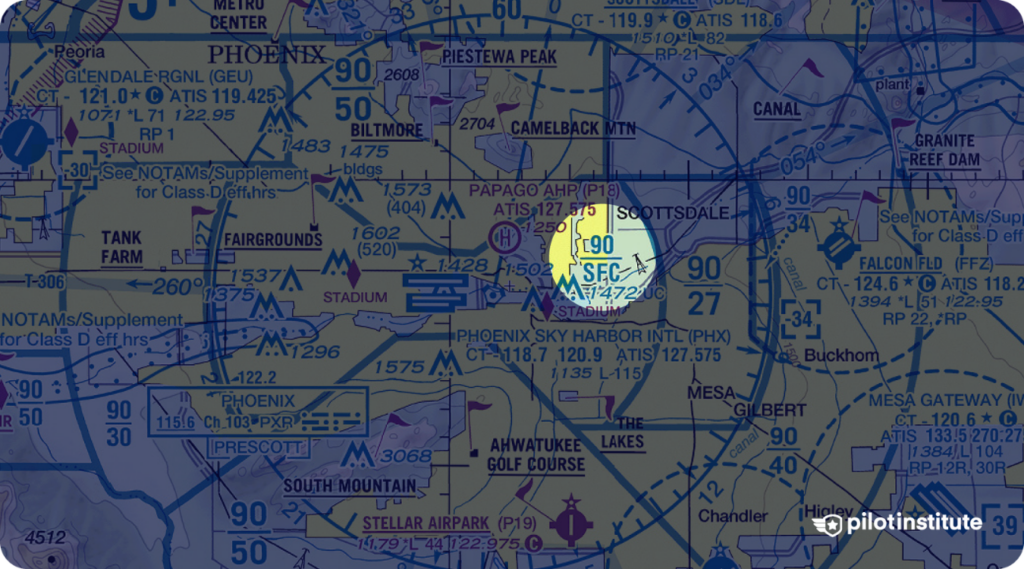
The innermost area is aligned with the airport’s runway and is labeled with the symbol above. This symbol indicates that the base of this particular area of Class B airspace starts at the surface and extends up to 9000 feet.
As you move further away from the runway, you will notice that the sections of Class B airspace start to become shorter.
At the eastern side of the runway is a section that starts at 2700 feet and extends to 9000 feet. Further outside is another section that starts at 4000 feet while having the same ceiling at 9000 feet.
Class C
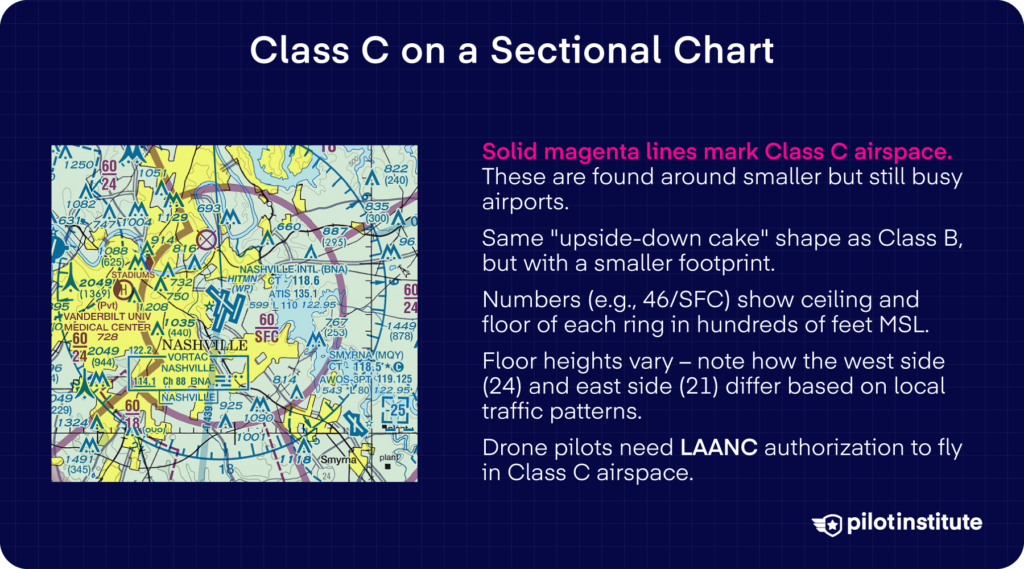
Sectional Chart Representation: Solid magenta line.
There’s very little difference between Class B and Class C airspace except that the latter is represented by different symbols in the sectional chart and applies to smaller and less busy airports.
It follows, then, that the extent of Class C airspace is likely smaller than Class B airspace. However, the upside-down cake orientation is a trait that both airspace classes share.
As an example, let’s look at the sectional chart showing the Nashville International Airport:
You may notice that the base and ceiling of the innermost area is again defined by the same type of symbol, indicating that Class C airspace starts at the surface and extends to 4600 feet.
The base varies on the west side (2400 feet) and the east side (2100 feet). These slight variations may have to do with the direction of air traffic in this airport or the presence of other air traffic facilities in the nearby areas.
Class D
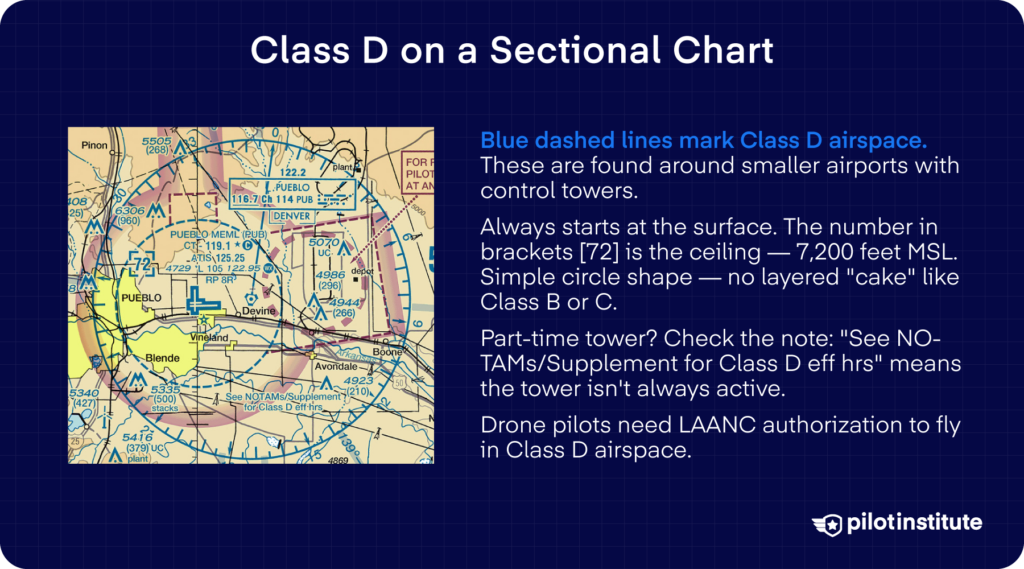
Sectional Chart Representation: Blue dashed line.
Class D airspace is assigned to the smallest airports in the country, which means that they also have the smallest extent out of all controlled airspace classes.
Aside from being relatively small, Class D airspace always starts at the surface, making them easier to represent in sectional charts. To demonstrate this, let’s look at the area surrounding the Pueblo Memorial Airport (PUB):
You can observe that the Class D airspace surrounding the airport merely takes the shape of a plain circle.
Instead of a figure indicating the base and ceiling of the controlled airspace, we only have a single number – 72 – enclosed by a square bracket. This represents the ceiling of Class D airspace in this area, which is 7200 feet.
Class E
Sectional Chart Representation: Several (see below)
Class E airspace refers to all other areas of controlled airspace that have not been covered by the previous categories. Because it fills in the empty spaces between the airspace classes B to D, most of the national airspace is actually categorized under Class E.
The good news is that most drone flight is authorized within Class E airspace without having to secure airspace authorization with just a few exceptions.
The general rule to follow is that you will still need airspace authorization if it occurs within the proximity of an airport. Otherwise, you can go ahead and fly your drone without making such a request.
There are a few different symbols used in representing Class E airspace, as follows:
| Class E airspace | Class E airspace starting at the surface and extending up to 700 feet. | |
 | Class E airspace from 700 feet to 1200 feet. | |
 | Class E airspace starting at 1200 feet. | |
 | This symbol indicates the floors of Class E airspace greater than 700 feet above ground level. |
Uncontrolled Airspace
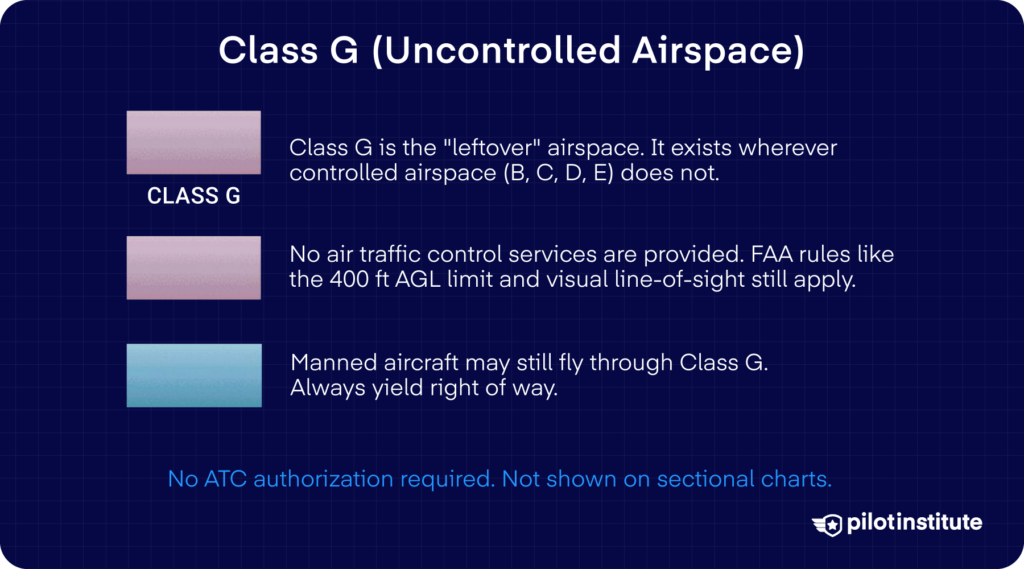
Class G, or uncontrolled airspace, is the least restrictive of all airspace types. Since it’s not under the jurisdiction of any ATC facility, there is no need to secure any authorization to fly in Class G airspace. This type of airspace is not explicitly marked in sectional charts.
The only thing to keep in mind is that Class G airspace still falls under the jurisdiction of the FAA, so their usual flight rules and regulations still apply.
Even when flying in Class G airspace, make sure to fly below 400 feet AGL and within visual line-of-sight. Manned aircraft may still cruise by Class G airspace, and a drone pilot is expected to always yield right of way.
Special Use Airspace
Special use airspace is a bit harder to define because of so many different types of flight restrictions and underlying causes classified under this category.
Some of them may have to do with national security, while others are meant to protect huge crowds. There are also types of special use airspace that are declared to protect the drone pilot, as in artillery testing and operations by the military.
The good news is that the different types of special use airspace are pretty easy to identify with their unique codes and symbols. Most of these symbols are summarized below:
| Special Use Airspace | Prohibited, Restricted, and Warning Areas | |
| Alert Areas and Military Operation Areas (MOA) | ||
| Military Training Route (MTR) |
Prohibited Areas
Prohibited Areas are labeled P-XXX (e.g. P-150) and are marked by solid blue lines with hash marks. As its name implies, drone flight in Prohibited Areas is strictly restricted, even if you have secured airspace authorization in the area. Prohibited Areas are typically declared for the sake of national security and welfare.
Restricted Areas
Restricted Areas are labeled R-XXX (e.g. R-120) and are marked by solid blue lines with hash marks. Drone flight in Restricted Areas is not completely prohibited, but a drone pilot will need to secure authorization from the appropriate controlling agency.
This agency may not necessarily be the FAA, as Restricted Areas may involve testing of military artillery and missiles. Approval of requests to fly drones in Restricted Areas is upon the discretion of the controlling agency.
Warning Areas
Warning Areas are marked W-XXX (e.g. W-110) and are bounded by solid blue lines with hash marks. Drone pilots may fly their drones in Warning Areas even without prior authorization but are advised to exercise extra caution.
Air traffic activity in Warning Areas is not as severe as in Prohibited and Restricted Areas but may still be hazardous to non-participating aircraft.
Alert Areas
Alert Areas are labeled A-XXX (e.g. A-220) are marked with solid magenta lines with hash marks. Air traffic over Alert Areas is expected to be unusually high, typically because of flight training exercises and air shows.
Another aspect of air traffic in Alert Areas is that it can proceed in ways that are unpredictable and unusual. As such, drone flight isn’t explicitly prohibited in Alert Areas, but drone pilots are advised to fly with extreme caution.
There may not always be a controlling agency for an Alert Area, so a drone pilot may proceed with their operations without securing prior authorization.
Military Operation Areas (MOA)
Military Operation Areas (MOA) are bounded by solid magenta lines with has marks and are labeled in a manner that is very hard to miss (e.g. BAGDAD MOA, GLADDEN MOA).
Military activities in MOA may range from training exercises to actual operations. This means that flying drones in MOAs is extremely dangerous and is not advised. If there is an operation ATC in the area, the facility may provide instructions on whether drone flight is cleared in a MOA.
Military Training Route (MTR)
Marked by arrow symbols in sectional charts, Military Training Routes (MTRs) are labeled with either a VR (visual rules) or IR (instrument rules) prefix followed by a number.
The number can have three digits (e.g. VR-120), indicating that the military operations are being conducted at above 1500 feet. On the other hand, the number can also have four digits (e.g. VR-1053), which indicates that the operations are being conducted below 1500 feet.
As its name implies, an MTR is a route that is used by the military for flight training. Since the aircraft in these routes fly at very high speeds, drone pilots are advised to steer clear of them.
Temporary Flight Restriction
Temporary Flight Restrictions (TFRs) are declared in areas where there are temporary hazards or security issues, prompting the restriction of uncontrolled aircraft flight.
The common reasons for declaring TFRs include the movement of the President or Vice-President, the presence of special foreign dignitaries, large-scale entertainment or sports events, disaster relief, or emergency response.
One thing common with all these reasons is that they are very serious, so a TFR is not something to be taken lightly. Drone flight is strictly prohibited in TFR areas unless authorization has been granted by the proper agency.
The penalties for violating TFRs are suitably heavy, as well, and can set a drone pilot back up to $100,000 in fines if their action has compromised national security.
As TFRs are fleeting by nature, they aren’t something that you can find in a standard sectional chart. Instead, the best source for up-to-date information on TFRs is FAA’s active TFR database.
The database is arranged chronologically by default, but can also be filtered by state. You may also view all active TFRs in an interactive map on the FAA website.
Frequently Asked Questions
- What information can be found on a sectional chart?
A sectional chart shows airports, radio aids, controlled airspace, special use airspace, obstacles, terrain, and other landmarks that help with navigation and flight planning. For most drone pilots, the biggest things to watch are airport symbols, airspace boundaries, terrain, and hazards that could affect a safe flight.
- How often are sectional charts updated?
FAA sectional charts are updated every 56 days. Even so, you should still check NOTAMs and active TFRs before each flight, since those can change between chart cycles and may not appear on the chart itself.
- What is the difference between a blue and magenta airport symbol on a sectional chart?
For airport symbols, blue generally means the airport has a control tower, while magenta means it does not. That color difference gives you a quick clue about the kind of traffic and communication environment you may be dealing with near that airport.
- Do you need to know how to read a sectional chart for the Part 107 test?
Yes. Reading aeronautical charts is part of understanding airspace, flight restrictions, and airport information, which all show up in FAA Part 107 study material.
Conclusion
Sectional charts are an invaluable tool for situational awareness and flight planning. Whether you’re flying professionally or for fun, checking out a sectional chart must be part of your pre-flight procedures if you don’t want to end up hitting a flight restriction when you’re already out on the field.
Looking at sectional charts can seem overwhelming for beginners. If you feel the same way, don’t worry – sectional charts are still somewhat confusing even for experienced drone pilots.
With a bit of patience, you will eventually learn to make the most out of all the information that a sectional chart offers. Learning to read a sectional chart isn’t just for your safety – it’s for the safety of all other aircraft in the national airspace, as well as the people on the ground.