Pilots often claim that the drive to the airport is the most dangerous part of any flight. And if you’re boarding a commercial airliner, this is true. In fact, you’re more likely to be struck by lightning than be in an airline accident.[1]
But does this hold true for private planes and personal flights? These flights, known as General Aviation (GA), have reached historically low accident rates. However, they still have some ground to cover before they can match the safety record of the airlines.
We’ve done extensive research to compare General Aviation accident rates to driving. This was not an easy task, but the effort was worth it.
In this article, we’ll compare driving and flying accident data, explore the leading causes of GA accidents, and discuss strategies for preventing them.
Key Takeaways
- General Aviation (GA) flights are significantly less safe than driving, with personal GA flights having a fatal accident rate over 27 times higher than driving.
- Pilot error is the leading cause of GA accidents, accounting for 69% of all incidents, with loss of control in-flight being the most common and fatal defining event.
- Personal flights account for the majority of GA accidents and fatalities, while instructional flights are much safer due to structured environments, supervised operations, and higher pilot proficiency.
- Mechanical failures are the second most common cause of GA accidents but result in fewer fatalities; issues like engine failures are often manageable, and about half are due to preventable factors involving pilots or maintenance.
Is GA Flying Riskier than Driving?
Comparing driving and flying safety isn’t easy. National safety agencies report air and road accident rates using different methods.
For instance, the National Highway Traffic Safety Administration (NHTSA) measures “accidents per 100 million vehicle miles traveled.” In 2021, they reported over 6.1 million crashes and 1.37 fatalities per 100 million vehicle miles.[2]
However, the National Transportation Safety Board (NTSB) uses “accidents per 100,000 flight hours.” In 2021, they reported 12,368 general aviation crashes between 2012 and 2021 and 0.95 fatalities per 100,000 flight hours.[3]
Considering there are many more cars than airplanes, what do these statistics mean for GA?
We can’t directly compare accidents per mile (driving) with accidents per hour (flying). So, to answer that question, we need a common metric to compare risk.
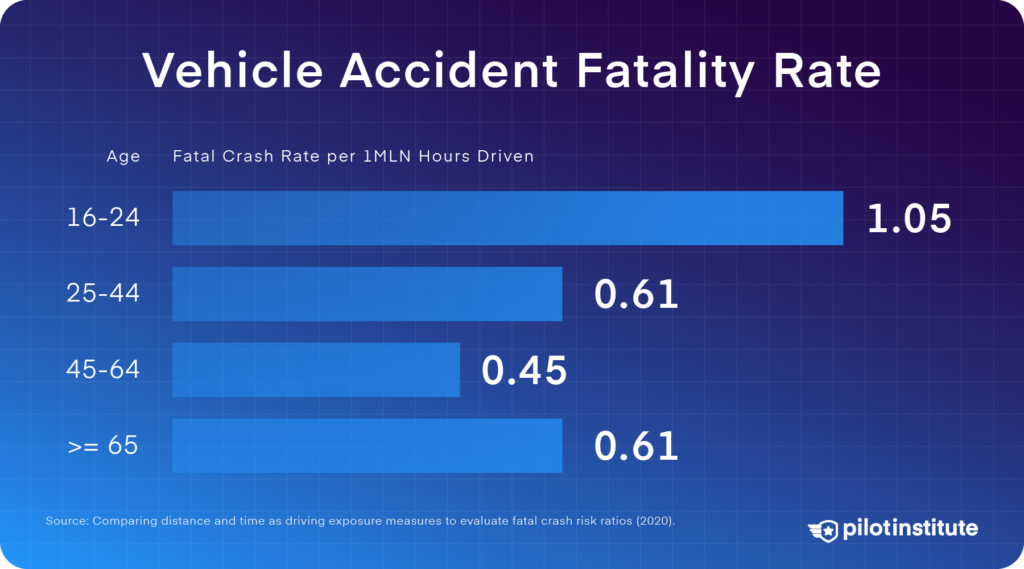
A 2020 study provided the solution. The research shows 0.6 to 0.7 fatal car crashes per million hours driven. The rate varies from 1.05 for young drivers to 0.45 for older drivers.[4]
What about motorcycles? NHTSA data reports that per vehicle mile, motorcycle accidents with fatalities occurred about 27 times more frequently than with cars.[5] So, there are about 16 to 18 fatal motorcycle accidents per million hours ridden.
How does this compare to GA flying?
Overall GA
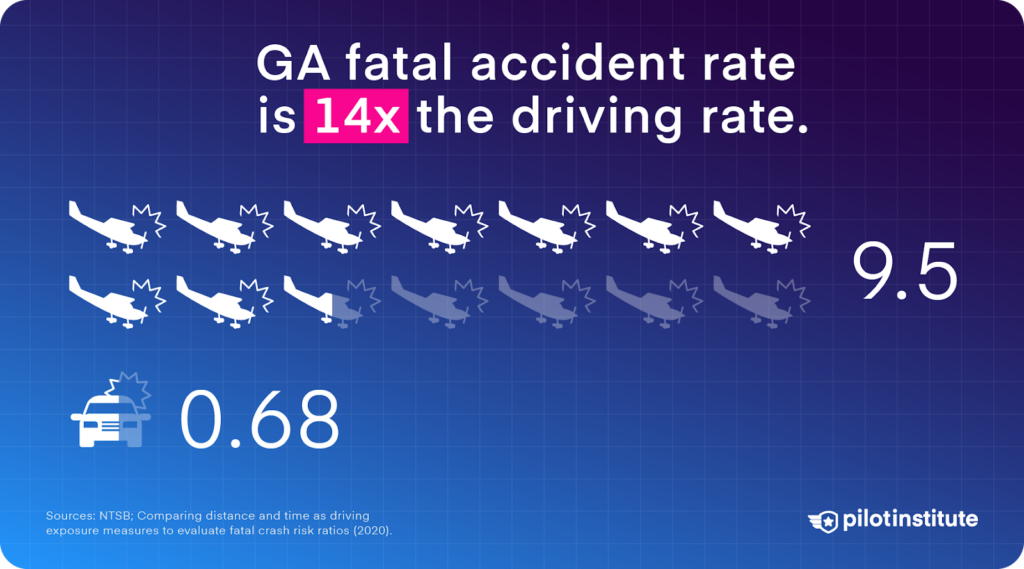
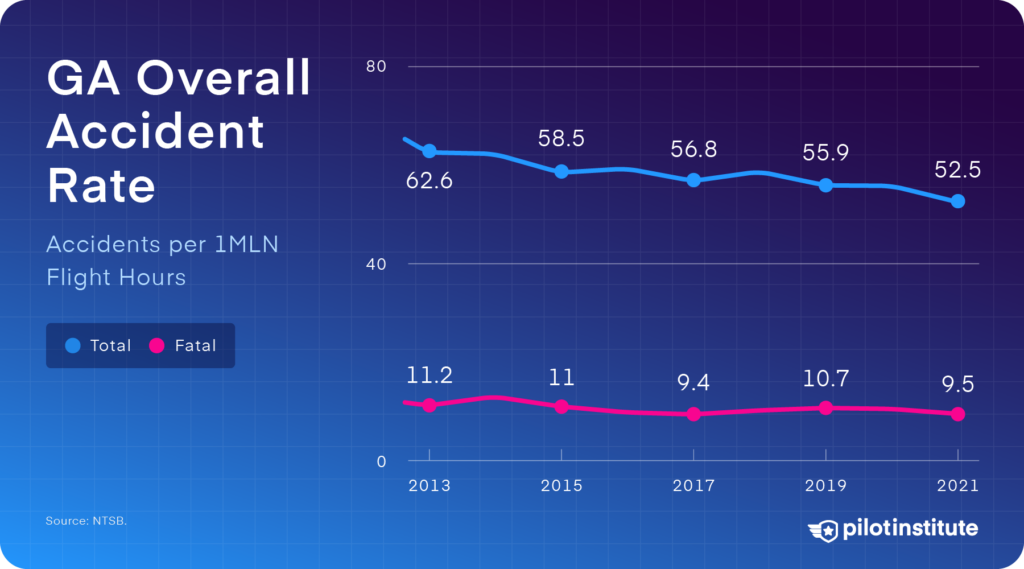
According to the NTSB, there were 0.95 fatal GA accidents per 100,000 flight hours in 2021.[3] Moving the decimal place easily converts this to 9.5 fatal crashes per million flight hours. That’s about 14 times the driving fatality rate [4] and half the motorcycle rate.[5]
Personal Flights
Now, the scope of General Aviation is vast, and not all types of flying are equally risky.
For instance, corporate aviation – the world of bizjets – is relatively safe. This sector only saw 0.48 fatal accidents per million flight hours from 2012 to 2021.
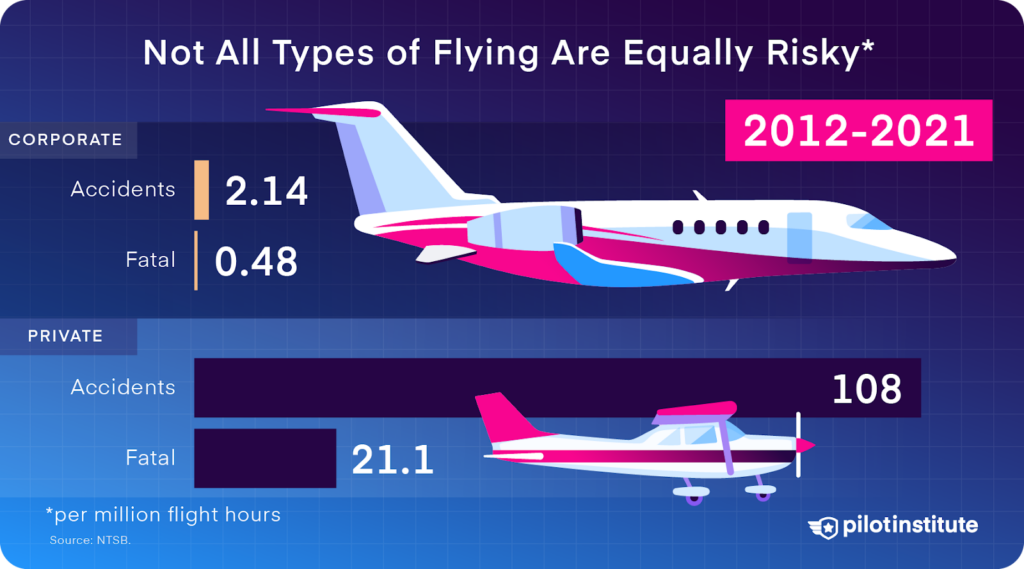
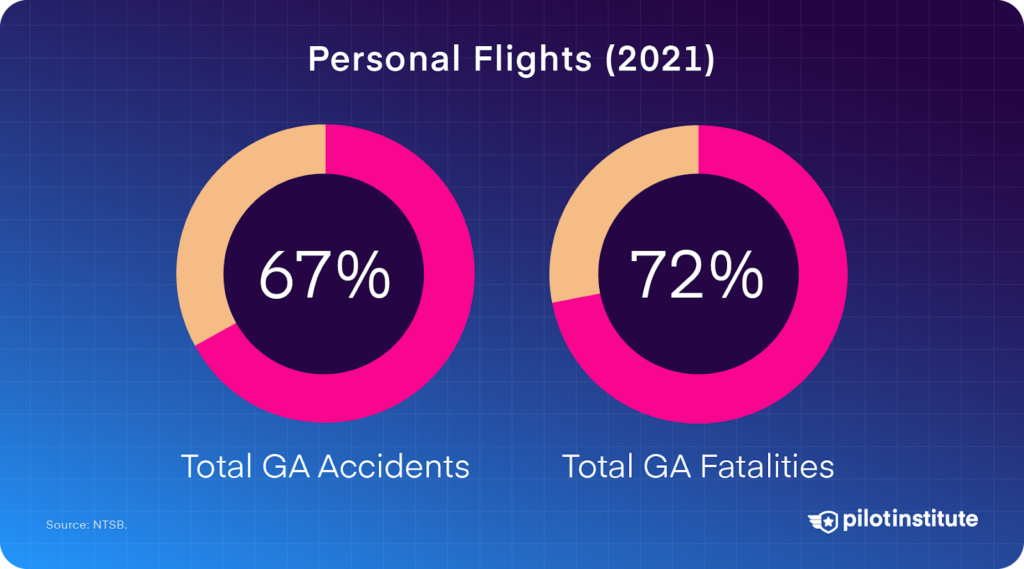
Personal flights, on the other hand, account for 67% of GA accidents and 72% of GA fatalities.[3] These are your $100 hamburger runs and cross-country family trips.
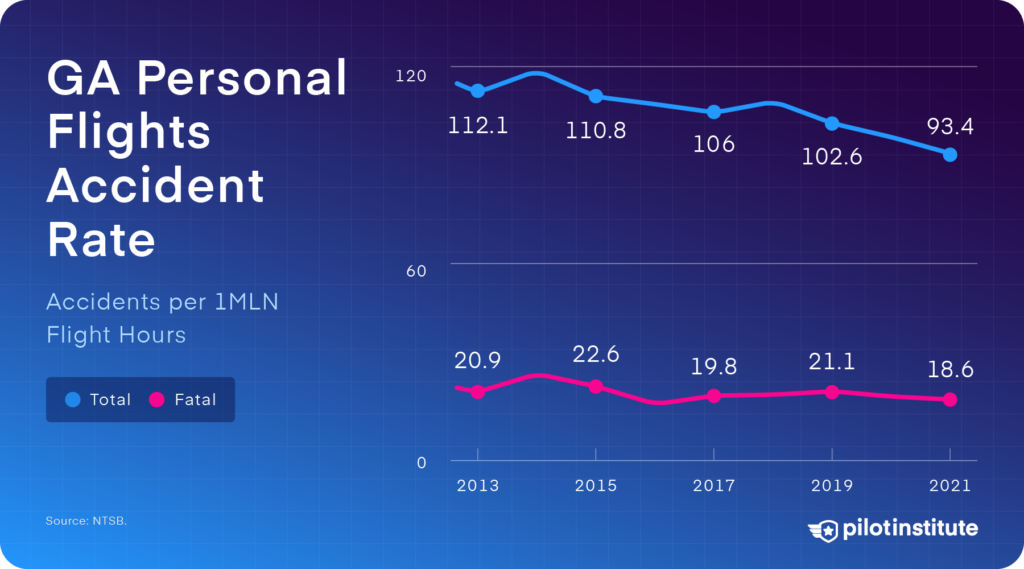
Between 2012 and 2021, this segment saw 21.1 fatal accidents per million flight hours.[3] Fatalities are down 24% from 2012, but it’s still over 27 times the driving fatality rate. That’s even more dangerous than riding a motorcycle.
Instructional Flights
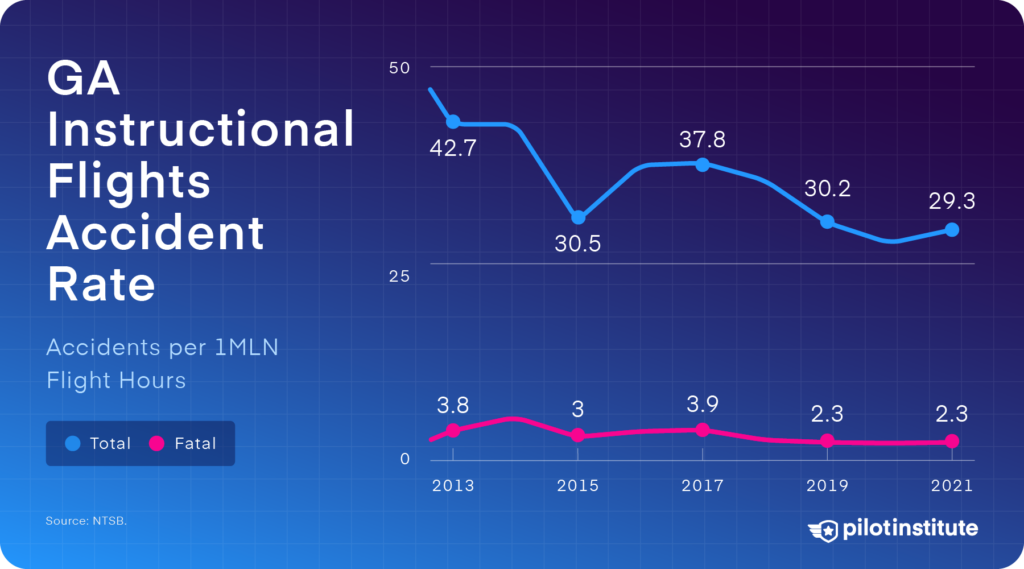
Instructional flights saw 2.3 fatal accidents per million flight hours, down 52% since 2012.[3] That means flight training is only 3.4 times more dangerous than driving.
Now, let’s examine what is causing so many GA accidents.
Risk Factors in General Aviation
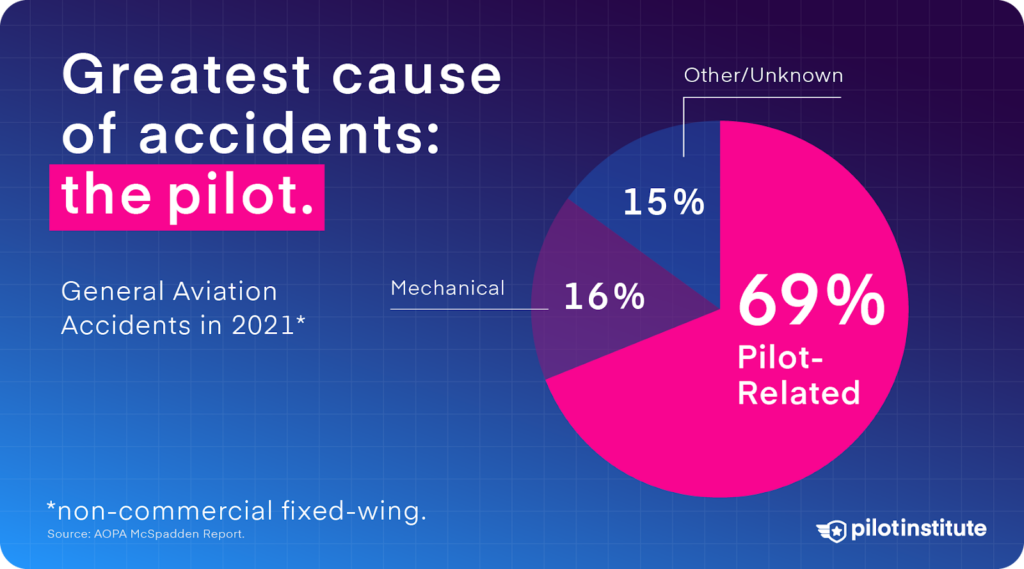
The AOPA’s Richard G. McSpadden Report divides accidents into Pilot-related, Mechanical, and Other/Unknown categories.
Other/Unknown Causes
In 2021, 15% of all accidents and 28% of fatal ones didn’t have a clear cause.[6]
These accidents are frustrating because without knowing why they happened, we can’t learn from them.
Mechanical Causes
The second most common cause of accidents is mechanical issues involving the aircraft itself. Mechanical failures comprised about 16% of all accidents but only 7% of fatal ones in 2021.[6]
“Mechanical accident” is still a pretty broad term, so let’s break it down piece by piece.
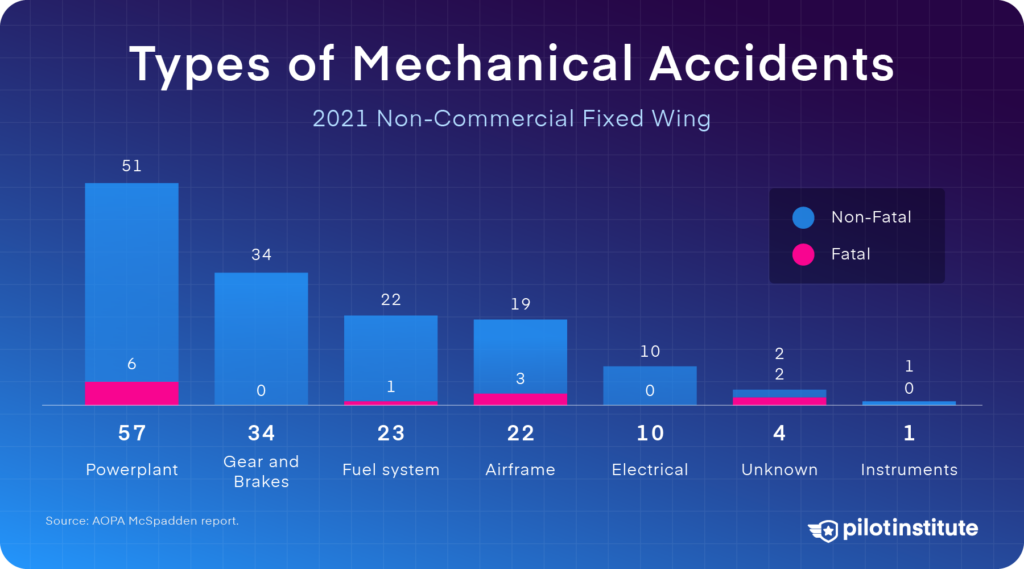
As expected, the engine is the most significant contributor to mechanical issues.
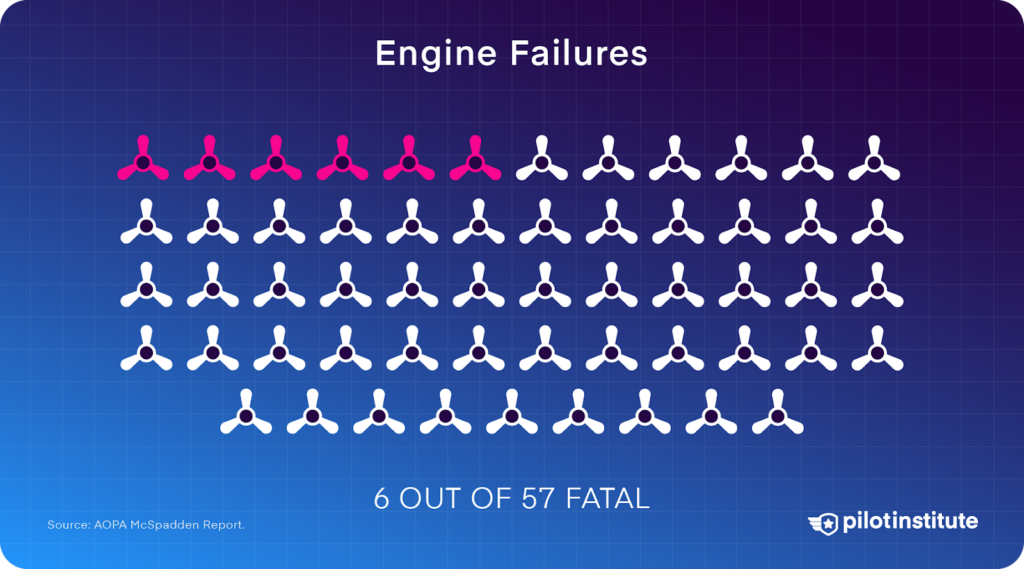
But here’s a surprising fact: out of the 57 engine failures reported that year, only six were fatal.[6] So, despite the fear factor, engine failures are generally manageable emergencies.
AOPA found that 30% of engine failures don’t have a clear cause. Maintenance issues are behind 16%, and structural failures 17%.[6] Common, preventable problems like carb ice or fuel issues account for the rest.
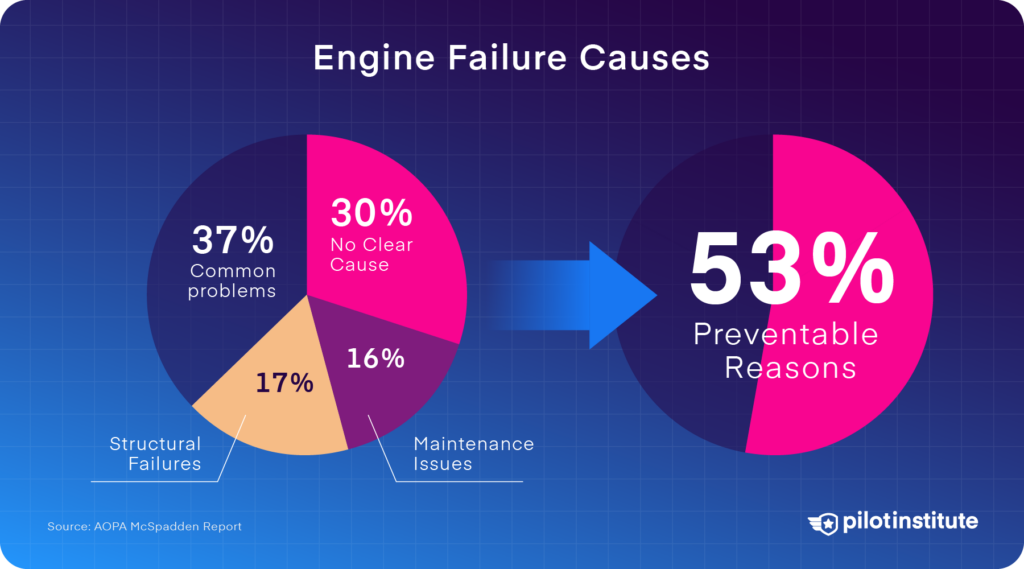
In other words, pilots or mechanics contribute to about half of all engine failures. That’s definitely an area we can improve.
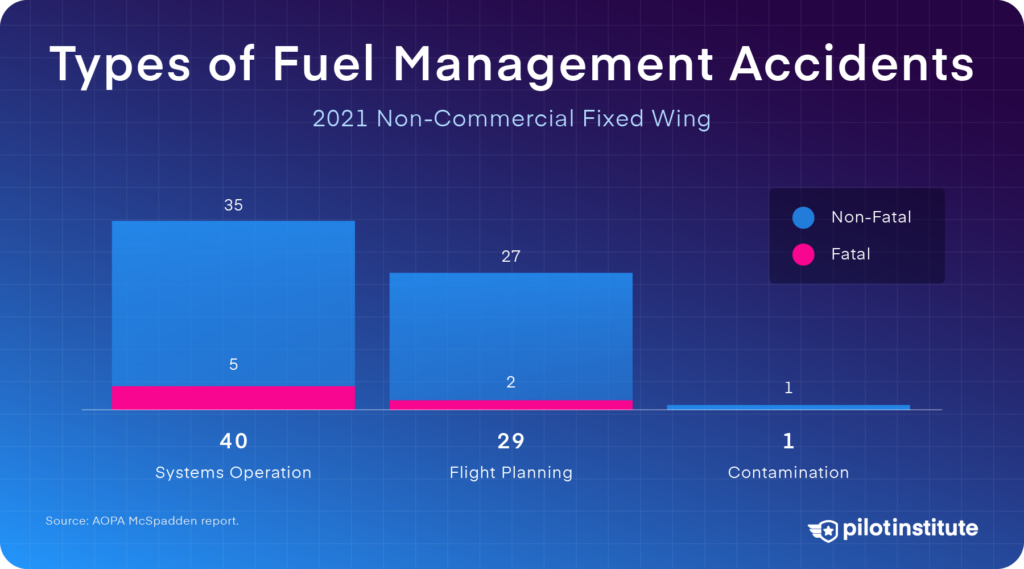
Speaking of fuel issues, another mechanical-related cause we should emphasize is the fuel system.
There are three main ways fuel-related accidents happen.
First, there could be something mixed in the tank other than fuel, most commonly water. This is called fuel contamination and is why we check the fuel before each flight.
Fuel issues could also occur because fuel is on board but isn’t getting to the engine, causing fuel starvation. Common causes are selecting the wrong fuel tank or placing the fuel selector in the OFF position. This is a dangerously easy mistake to make.
Lastly, pilots sometimes simply run out of fuel. Fuel exhaustion is frequently caused by poor flight planning.
Now, let’s investigate the most significant cause of accidents in general aviation: the pilot.
Pilot-related Causes
Since the early days of aviation, people have studied aircraft safety and risk. Despite efforts to teach pilots effective risk management techniques, human factors remain the leading cause of accidents.[6]
Pilot-related accidents have trended downward over the years but have since plateaued. In 2021, investigators deemed the pilot at fault in 69% of all GA accidents (647 out of 938). That’s a hard truth for pilots to face.[6]
The NTSB shows us a more detailed view of these causes, classified as “defining events.”
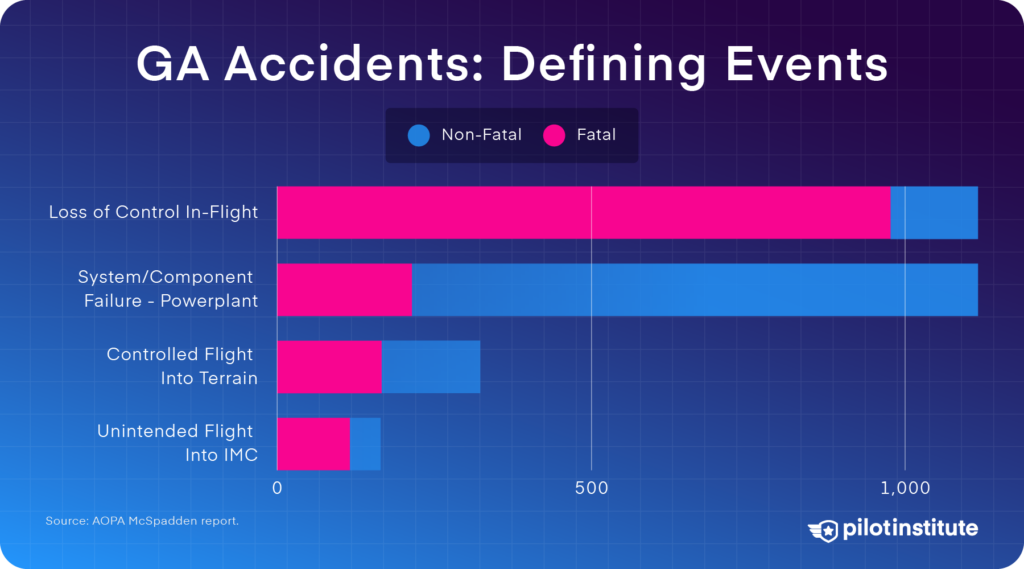
If we look at the top spot, the NTSB lists loss of control in-flight (LOC-I) as the most common cause of accidents and the most fatal.[3]
Loss of Control In-Flight
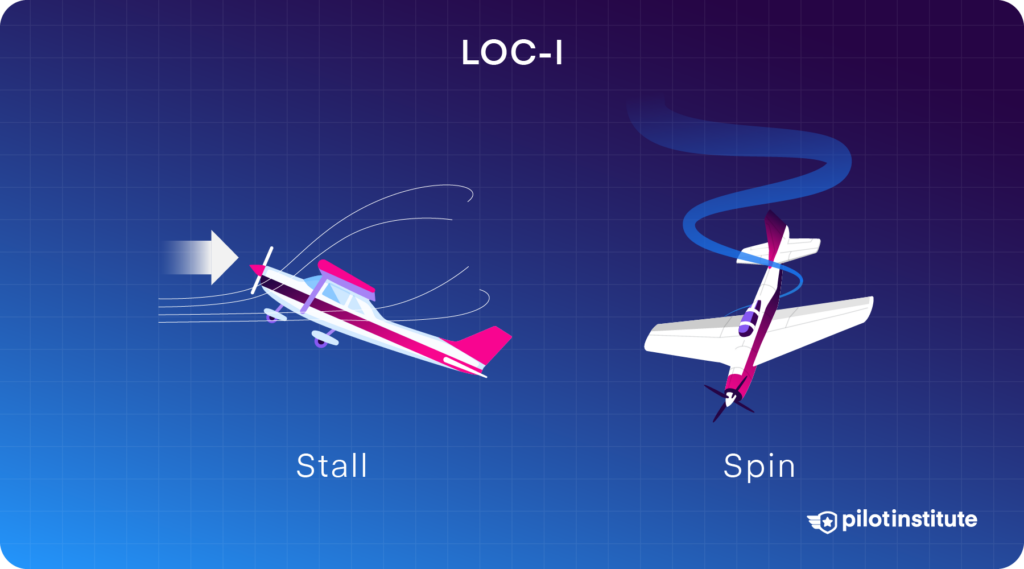
LOC-I typically means the pilot lost control of the airplane. They could have been flying too slow or made uncoordinated and abrupt control inputs. Half of these accidents are stalls and spins in the traffic pattern during maneuvering flight. These are seldom recoverable.
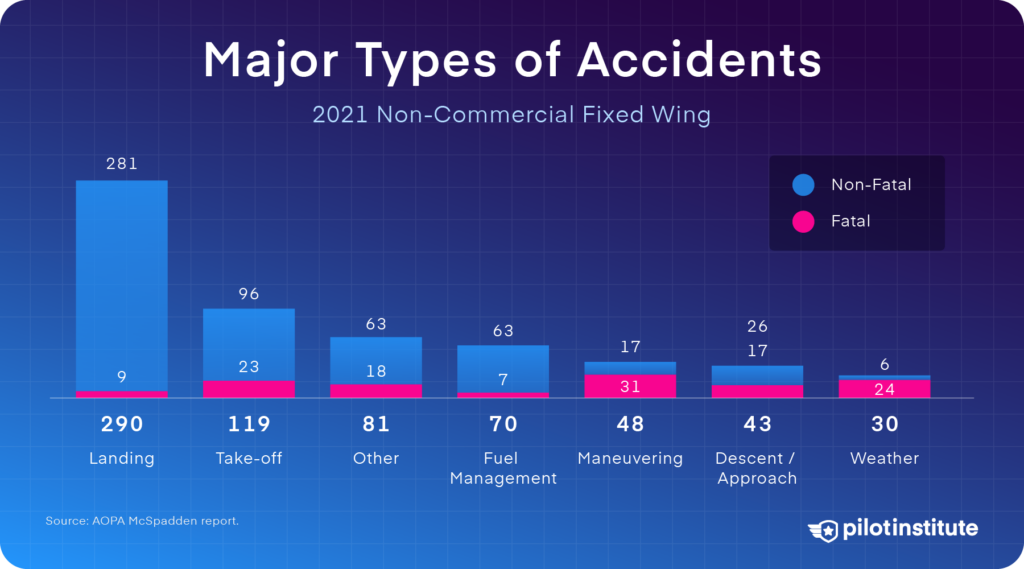
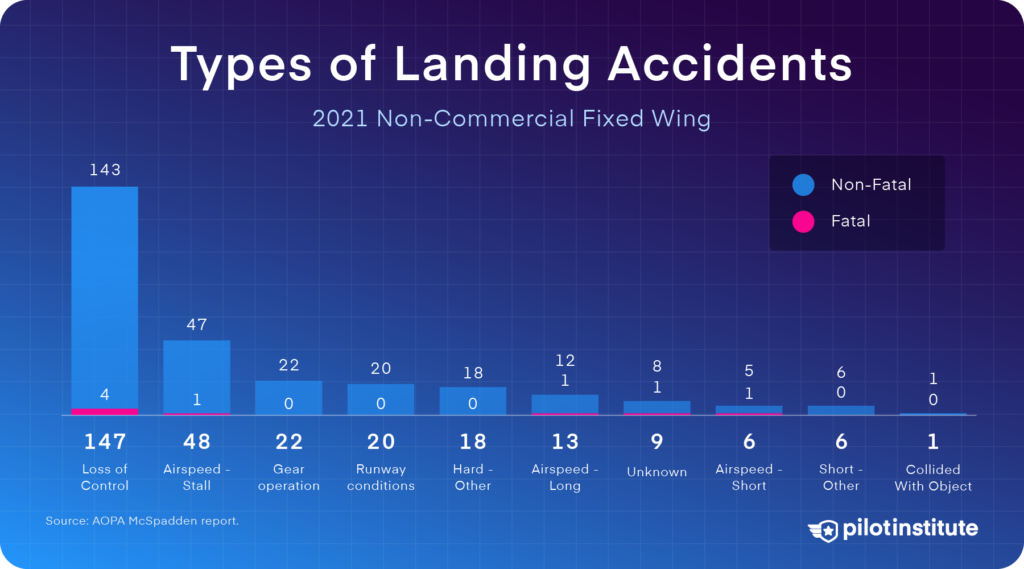
Landings
Many GA accidents happen during landing, but they are not typically the most fatal. The most common landing accident is loss of control.
Takeoff and Climb
Takeoff and climb accidents have a higher fatality rate. The airplane is in a low-energy, low-altitude state with a high angle of attack, leaving little room for error in an emergency.
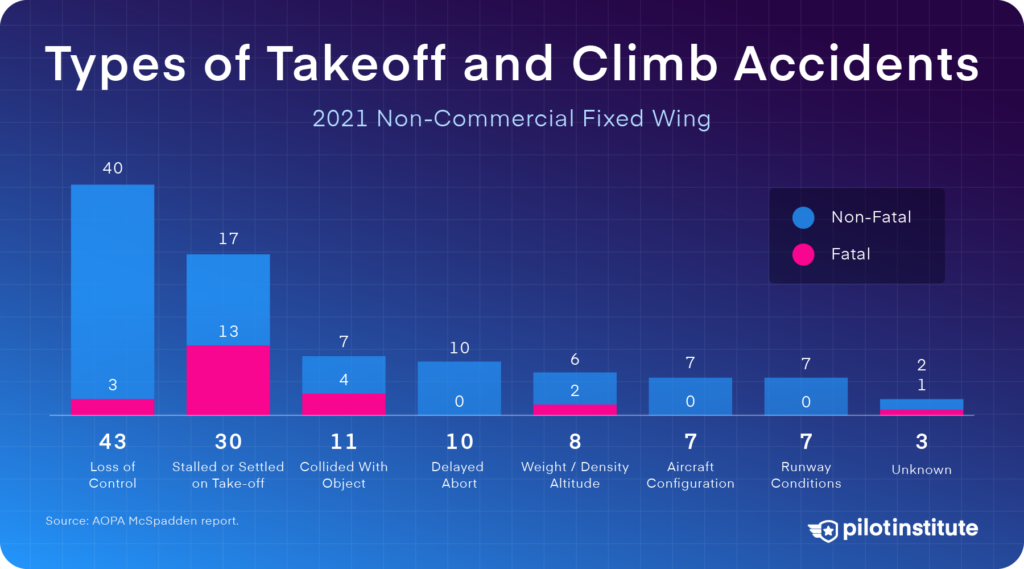
While stalls may not be so fatal during landing, they’re the deadliest cause of takeoff and climb accidents. Thirteen out of 30 reported stall-related takeoff accidents were fatal in 2021.[6]
Many of these accidents likely resulted from attempting the “impossible turn.” If you’re unfamiliar with that risky maneuver, read about it here.
Controlled Flight into Terrain
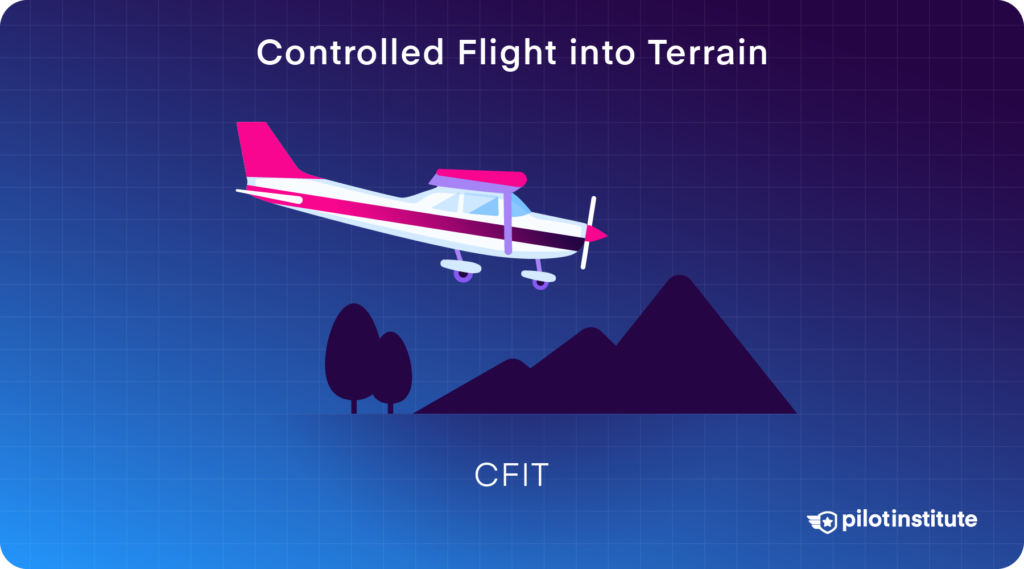
Now, let’s look at the other leading causes of fatal accidents. Controlled Flight Into Terrain (CFIT) is fairly self-explanatory. It’s an unintended collision with the ground or obstacle and is frequently a result of a total loss of situational awareness or attempts to “push” below minimums during instrument procedures.
Unintended VFR Flight into IMC
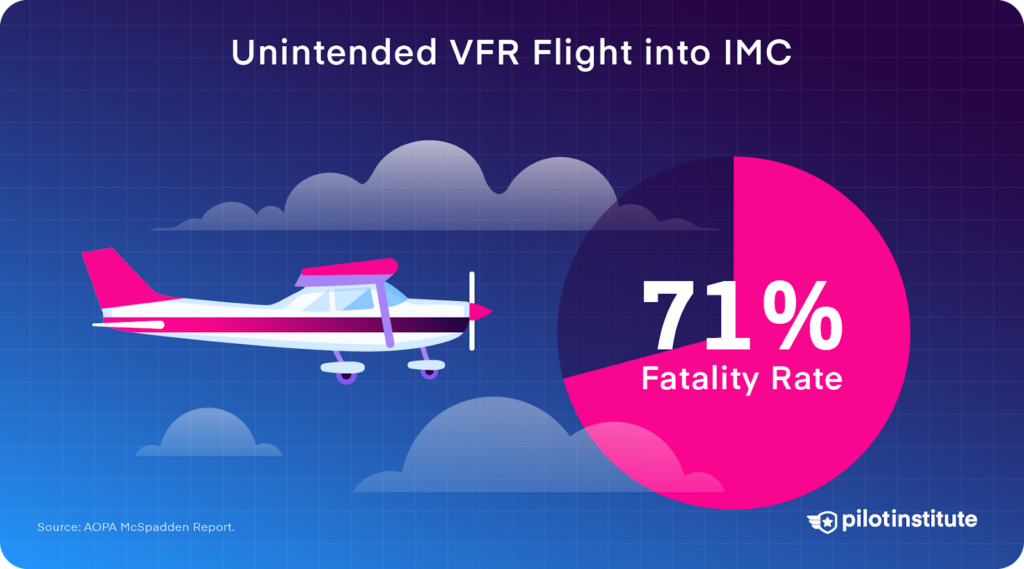
Another avoidable cause is unintended VFR flight into instrument meteorological conditions. Accidents caused by flying visually into clouds or low visibility had a 71% fatality rate in 2021.[6]
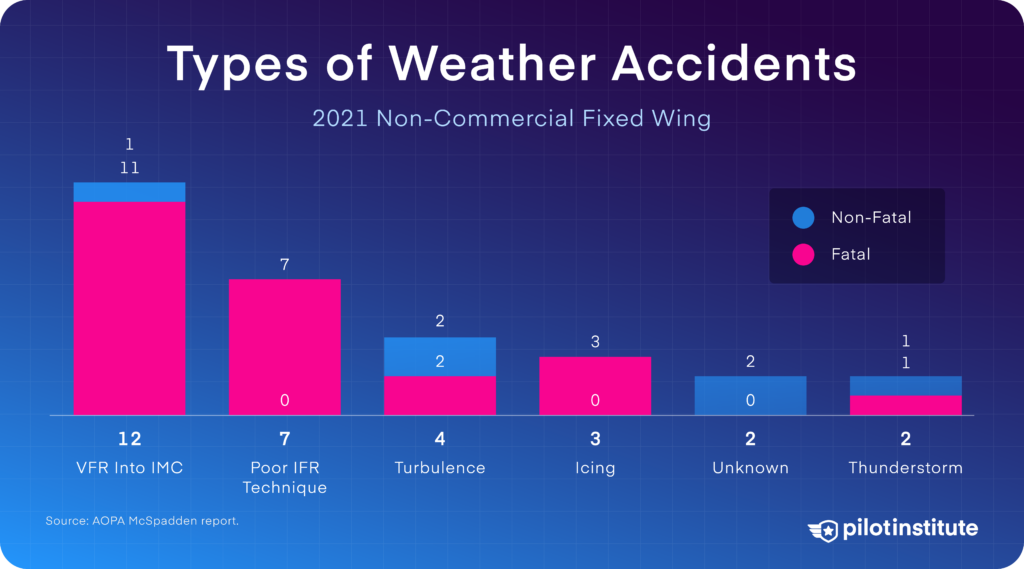
Poor IFR technique and icing were deadly in 2021.[6] Flying in IMC requires pilots to be on their A-game, which often means canceling the flight altogether. Most GA airplanes have no business flying in icing conditions or thunderstorms.
So, what can we learn from these humbling statistics?
Well, general aviation flying may never be as safe as driving. But there’s a lot we can do to reduce risk while still enjoying the freedom of flight.
The key for pilots is not just staying current – in other words, legal – but proficient. Proficiency requires going above and beyond the legal minimums.
But we can do more than that.
Safety Measures and Best Practices
Let’s consider instructional flights again. Why is the fatality rate an eighth of personal flights?
First, instructional flights occur in a supervised environment.
Second, flight schools are highly structured operations. Risk-taking is not accepted.
Third, flight schools typically maintain their instructional airplanes to high standards. Unlike personal airplanes, they must undergo an inspection every 100 hours.
And finally, instructors tend to be more proficient than private pilots who only fly once a month.
These reasons mirror why airline travel is so safe. Airlines are structured and risk-averse operations. And their pilots are highly trained and proficient.
The good news for GA pilots is that nothing is stopping us from modeling a safety mindset.
Conclusion
As aviators, we must stay disciplined and make wise decisions, even when no one’s watching. Even minor lapses in judgment can snowball into big problems.
Accident case studies are a great way to see how quickly these errors can pile up. Watch this video for a clear illustration of how fast things can go wrong.