-
Key Takeaways
-
What Is an IFR Approach Chart?
-
Sections of the IFR Approach Chart
-
Approach Briefing Strip
- Airport/Runway Information Box
- Requirements, Limitations and Notes
- ALS and Missed Approach Procedure
- Frequency Box
-
Decoding the Plan View
- Altitude and Airspeed Restrictions
- MSA
- Missed Approach Inset
- NAVAIDs
- Other Symbols
-
Breaking Down the Profile View
- FAF
- VDP
- Missed Approach Point
- Missed Approach Icons
-
Understanding the Minimums Section
- Aircraft Categories
- Approach Types
- Understanding Landing Minima
-
Understanding the Airport Sketch
- Time/Distance Table
-
Conclusion
Flying under Instrument Flight Rules (IFR) can, at times, feel like deciphering a complicated puzzle, especially when you’re staring at an approach chart filled with intricate details.
Approach charts, often referred to as approach plates, become your guide when visual cues are scarce. They pack a wealth of information—from navigation aids and altitude requirements to missed approach procedures—onto a single page.
Let’s break it down together.
Key Takeaways
- IFR approach charts show all the required information for a specific instrument approach.
- Charts are split into briefing, plan view, profile view, and minimums.
- Verify chart validity, required equipment, and restrictions before flying.
- Follow the published missed approach procedure unless ATC gives other instructions.
- Approach minimums depend on approach type, aircraft category, and notes in the briefing.

Start with the Right Study Plan
Use the sheet as your roadmap, then reinforce with lessons and quizzes.
- Fits any ground school.
- Find weak spots.
- Test-day essentials.
- Extra resources.
What Is an IFR Approach Chart?
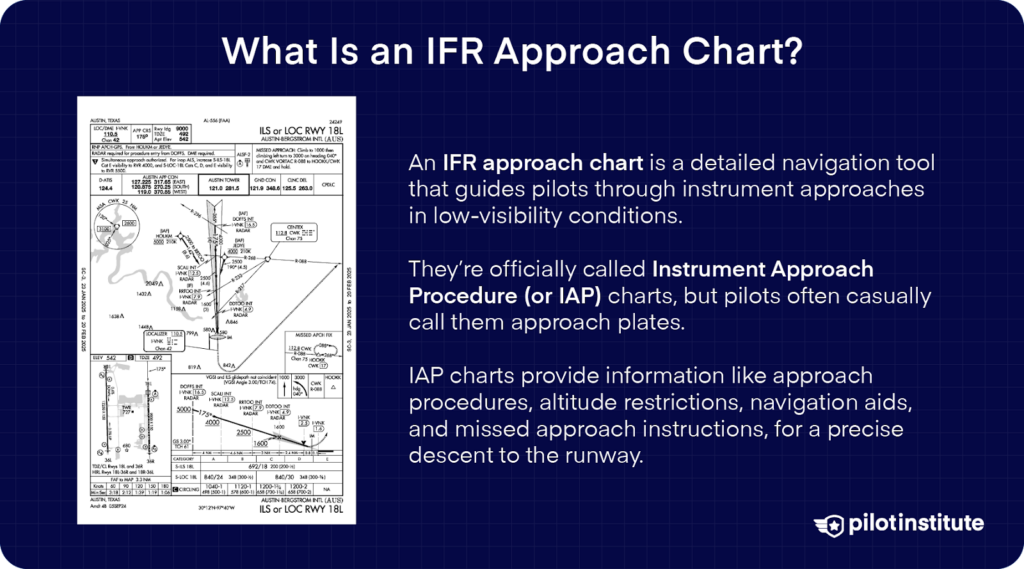
An IFR approach chart is a chart that organizes all the information you need to perform a particular IFR approach. They’re officially called Instrument Approach Procedure (or IAP) charts, but pilots often casually call them approach plates.
IFR approaches can be very complicated, and you need to keep track of lots of data, including:
- The route.
- The descent profile.
- The procedure for the missed approach.
- Communication and navigational radio frequencies.
- Approach minima.
- Hazards in the area.
- Requirements and restrictions for the approach.
- Airport information, such as the length of the runway and the approach lighting pattern.
It’s no small feat to arrange all that on a single page, but the result does look fairly complicated. As a pilot flying this approach, you need to know where to look for the right information at the right time.
Here’s how to make sense of it all.
Sections of the IFR Approach Chart
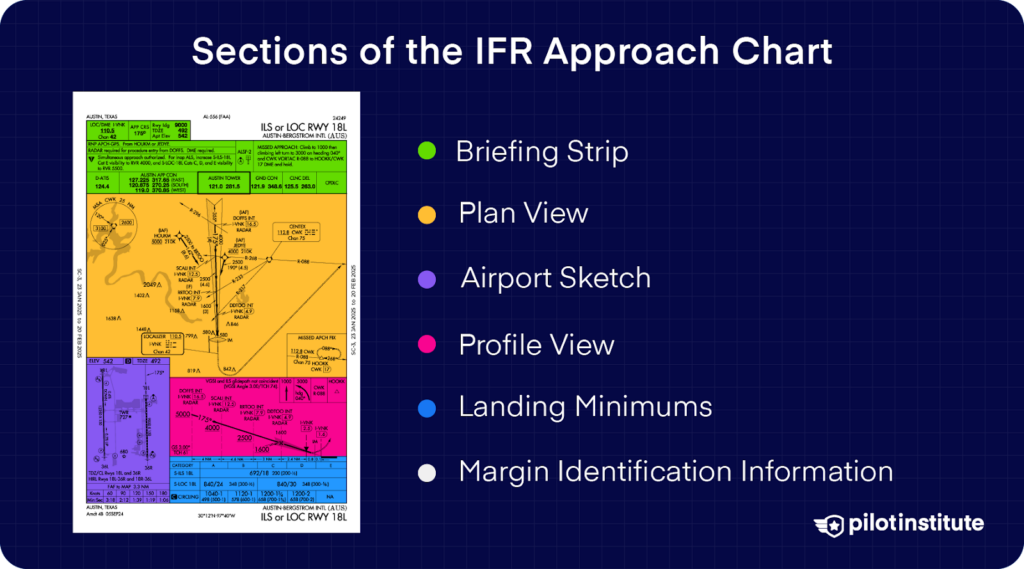
An approach plate has four main sections:
- Approach Briefing Strip
- Plan View
- Profile View
- Landing Minimums
The borders or margins of the approach plate help you identify the plate and check its validity.
FAA charts also add an airport diagram section showing the runway layout and lighting information.
Let’s go over each section in detail.
Approach Briefing Strip
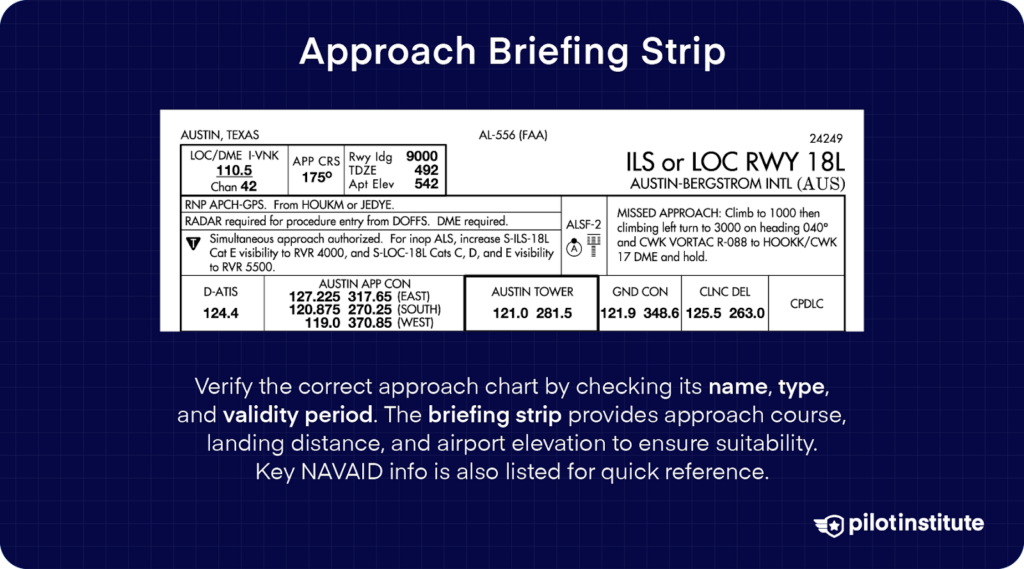
Whenever you look at an approach plate, your first task is to ensure you’re looking at the correct chart. That’s why every chart has the type of approach and the name of the airport written in large letters on the top and bottom right.
The next step is to verify that the chart is valid. FAA charts show the validity period in the side margins.
Once you’re sure you’re looking at the correct chart, move on to the briefing strip.
Airport/Runway Information Box
This section first provides basic information about the approach. It tells you the approach course, the available landing distance, and the elevation of the airport and touchdown zone.
Use this box to determine if this approach will be appropriate for your aircraft and your approach entry.
Most approaches are based around one primary NAVAID. The identifier and frequency of this NAVAID are listed here for your convenience.
Requirements, Limitations and Notes
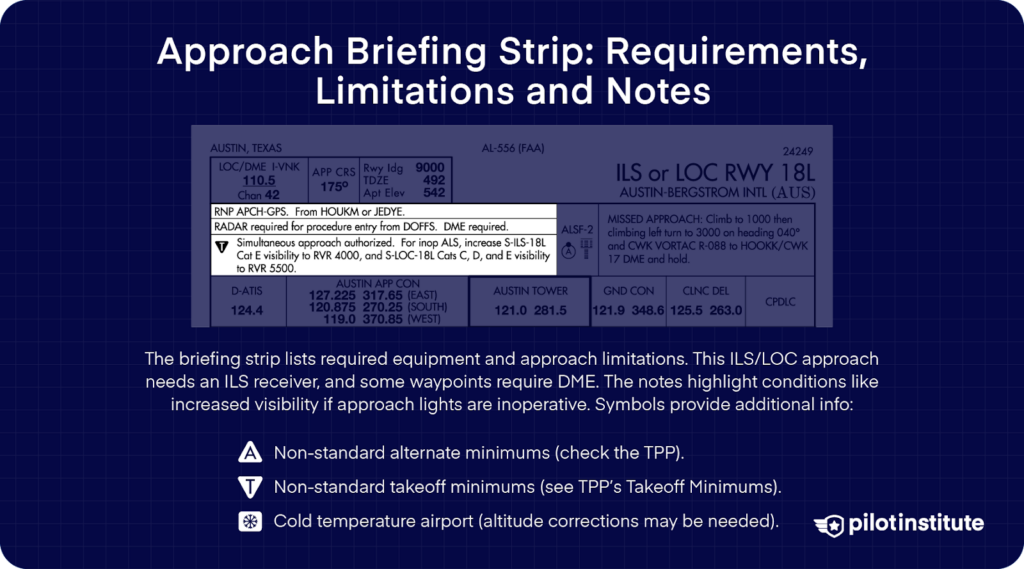
This section lists the equipment required to operate this approach and any restrictions or limitations you must follow.
Since this example chart shows an ILS or LOC approach, you already know your aircraft requires a functioning ILS receiver.
However, if you look at the requirements section, you’ll find that you also need Distance Measuring Equipment (DME) if you’re entering from a particular waypoint.
The notes section tells you what to do in certain conditions. For example, the visibility requirements go up if the runway approach lights aren’t working. If you fly the approach with the lights out, you’ll have to follow the new limits.
The notes box can also include some symbols to alert you to situations where standard rules don’t apply. Here’s what they mean:
- The A Triangle—this airport or runway has non-standard alternate minimums. If you choose this airport as an alternate, you must check the airport minimums section in the Terminal Procedures Publication (TPP).
- The T Triangle—this airport or runway has non-standard takeoff minimums. Search for the airport in the TPP’s Takeoff Minimums and Departure Procedures section.
- The Snowflake Symbol—this is a cold-temperature airport. If the temperature drops below the limit, you’ll have to apply altitude corrections for cold temperatures.
ALS and Missed Approach Procedure
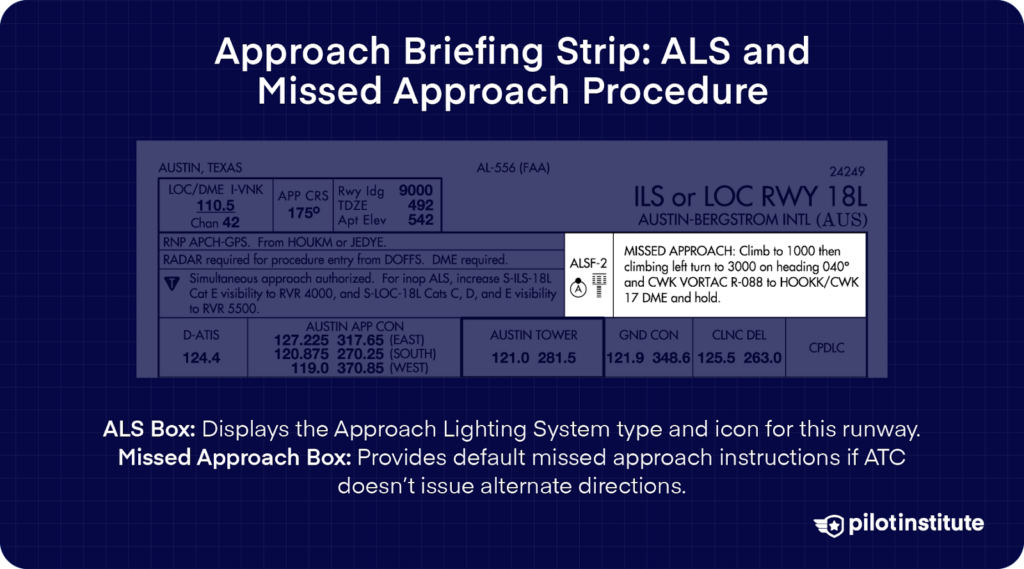
The ALS box shows the Approach Lighting System installed on this runway. The box lists the lighting type name and shows an icon representing the type of lighting you can expect.
The missed approach box explains what to do if you execute a missed approach.
Sometimes, ATC may issue alternate instructions when you go around. If they don’t give you any directions, you’ll have to follow the instructions in this box.
Frequency Box
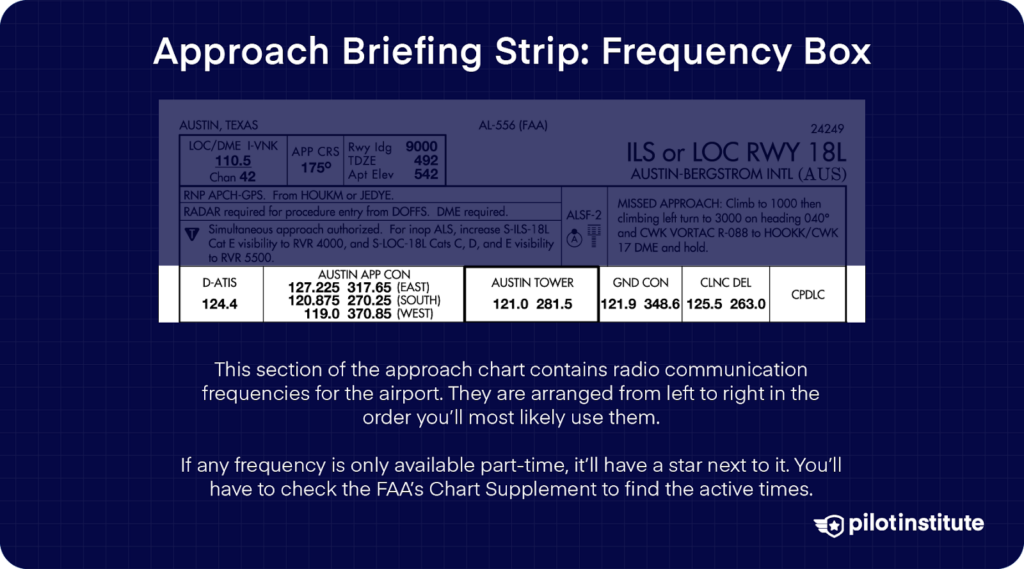
This section includes the frequencies you’ll need to contact, helpfully arranged from left to right in the order you’ll most likely use them.
If any frequency is only available part-time, it’ll have a star next to it. You’ll have to check the FAA’s Chart Supplement to find the active times.
Decoding the Plan View
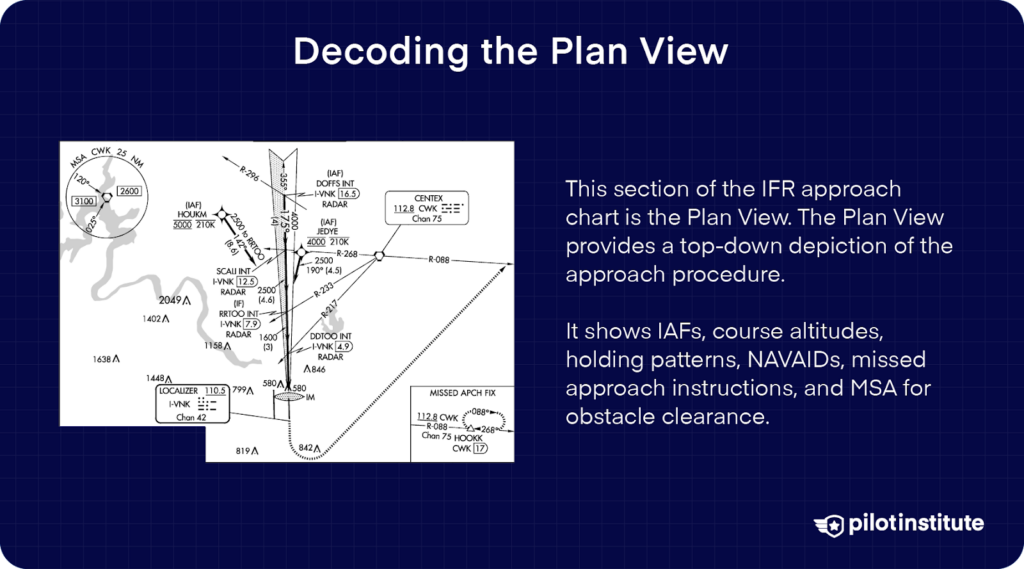
Simply put, the plan view looks like a map with arrows showing the route of the approach.
The approach starts when you arrive at the Initial Approach Fix (IAF). The plan view labels these points as IAF above the fix identifier.
When you cross the IAF, you enter the initial approach phase. Some initial approaches lead directly to the final approach. Many approaches have fixes in between called Intermediate Fixes (IF). If present, the plan view will label them as IF.
Intersections at fixes are labeled INT. They include the DME distance inside a D symbol.
How do you use intersections?
Intersections help you cross-check your position. If you’re flying the approach shown, you can verify reaching the fix RRTOO if your DME shows 7.9 and you are on the 233 radial from the CWK VORTAC.
Altitude and Airspeed Restrictions
Many approaches have altitude or airspeed restrictions at some fixes. The plan view shows them as numbers underneath the fix name. Here’s what they mean:
- If a number is underscored, you must fly at or above that altitude.
- If a number is overscored, you must fly at or below that altitude.
- If a number is underscored and overscored, it’s a mandatory altitude.
If you’re flying a non-precision approach, such as a localizer approach, step-down altitudes apply. When flying a precision approach, you have to follow the restrictions only until you intercept the glideslope.
Some fixes have airspeed limits as well. They’re depicted similarly to altitude restrictions on the plan view.
MSA
FAA charts have an MSA circle on the plan view. MSA means Minimum Safe Altitude.
MSAs are used in emergencies. If you lose your bearings and are struggling to find the airport, you don’t want to hit something accidentally.
Flying at MSA guarantees at least 1,000 feet of obstacle clearance.
The MSA circle is centered around the main NAVAID for the approach. It divides the surrounding airspace up to 25 NM from the airport into segments. Each segment in the circle has its MSA labeled.
Missed Approach Inset
The missed approach section starts right after the missed approach point. The plan view shows it as dashed lines leading out from the runway.
For most approaches, the fix for the missed approach holding point is too far from the airport. That’s why the plan view shows the missed approach hold in an inset.
Whenever you see a dashed line leading out from the boundary, look for the inset to see where the holding fix is.
NAVAIDs
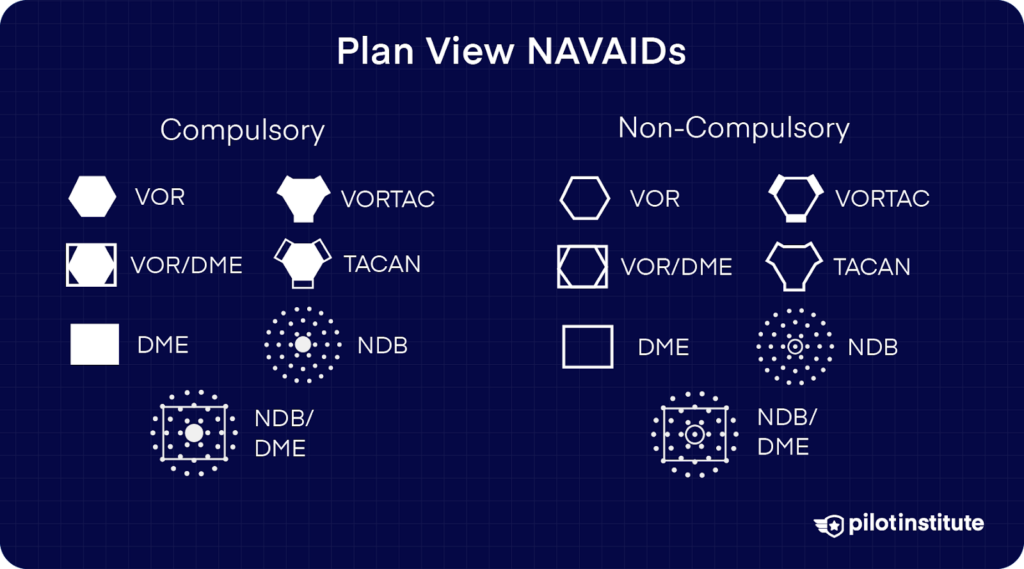
The plan view shows only NAVAIDS relevant to the approach. This includes the primary NAVAID along with any NAVAIDS needed for feeder routes or intersections.
NAVAIDS used to define the missed approach route or holding pattern are also visible even if the final approach may not use them. Each NAVAID has its name, identifier, and frequency labeled.
Brush up on your NAVAID symbols!
Other Symbols
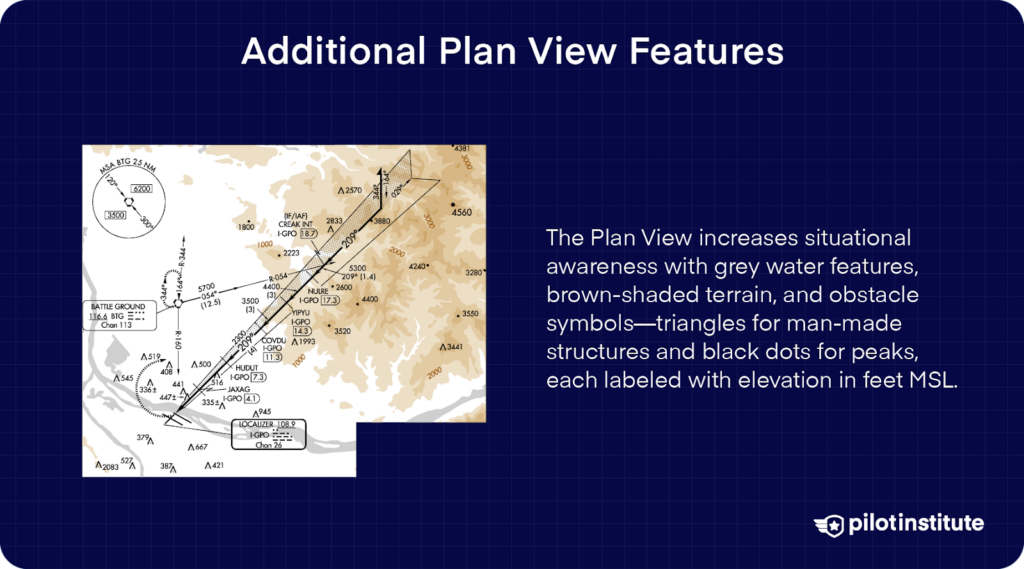
The plan view provides extra detail to help with situational awareness. It shows water features marked in grey. High terrain near the approach path uses shades of brown to represent height.
The plan view shows individual tall obstacles such as towers, antennas, and even natural obstacles like mountain peaks.
Man-made obstacles have a triangular symbol. Peaks in high terrain use a black dot. Every obstacle’s elevation in feet MSL accompanies its symbol.
Breaking Down the Profile View
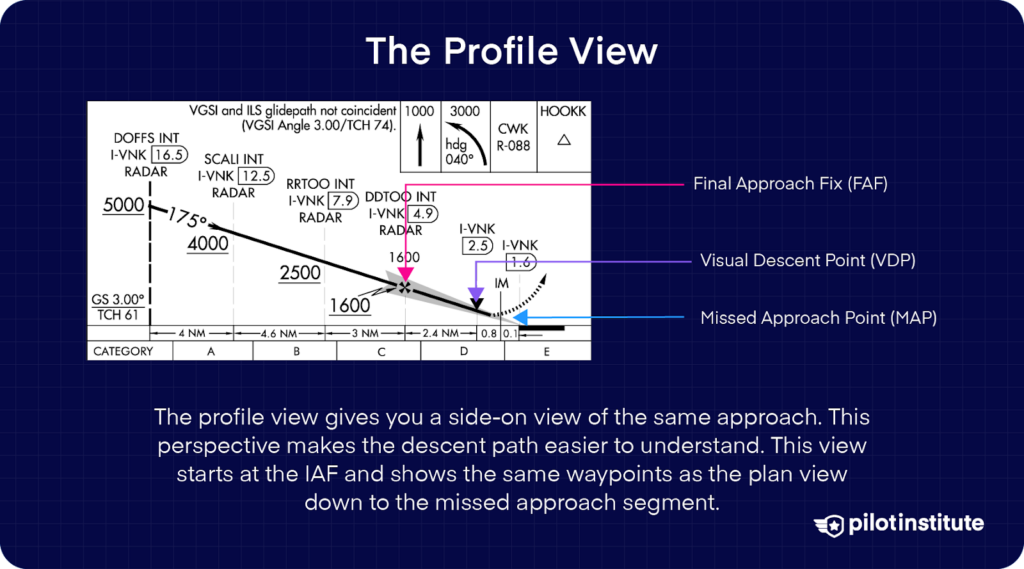
The profile view gives you a side-on view of the same approach. This perspective makes the descent path easier to understand. This view starts at the IAF and shows the same waypoints as the plan view down to the missed approach segment.
FAF
One of the profile view’s unique features is that it marks the Final Approach Fix (FAF) distinctively.
- Precision approaches (such as ILS) use a jagged arrow to mark the FAF. This is the point where you should intercept the ILS glideslope.
- Non-precision approaches (such as a localizer, VOR, LNAV, or NDB) use a Maltese cross ✠ for the FAF. At this point you should start descending to the Minimum Descent Altitude (MDA).
These two icons are often but not always co-located. Take care to follow the icon that fits the type of approach you’re flying.
VDP
You can also see a bold V marked on many straight-in non-precision approaches.
That V represents the Visual Descent Point or VDP. If you see the runway by the time you arrive at the VDP, you’re allowed to descend below the MDA. This will give you a stabilized, manageable descent to the runway.
Missed Approach Point
The Missed Approach Point (MAP) is the last point by which you should decide to land or execute a missed approach.
Precision Approaches
When you’re flying a precision approach, your descent is continuous. You’re allowed to fly down to the Decision Altitude (DA), which becomes your missed approach point.
This means the MAP isn’t a fixed point for precision approaches (it depends on where you reach the DA). That’s why the profile view for precision approaches won’t have the MAP marked.
The solid approach path line simply changes into the dashed missed approach path line.
Non-Precision Approaches
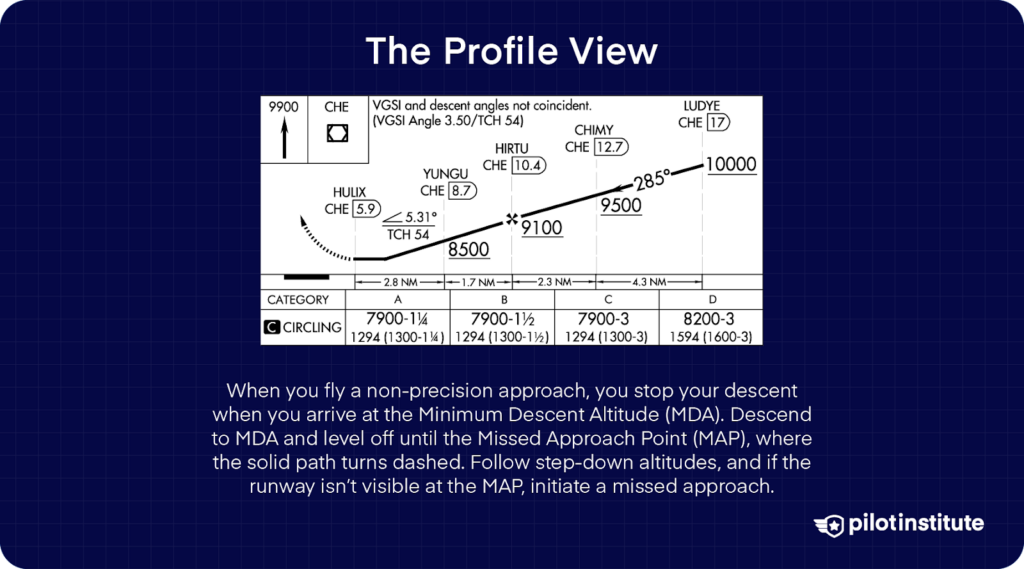
When you fly this type of approach, you stop your descent when you arrive at the Minimum Descent Altitude (MDA). At that point, you’re supposed to level off and maintain altitude till you reach the MAP.
Since the MAP is a fixed point for these approaches, it’s easy to define here.
The key to identifying the MAP is noticing where the solid approach path line changes to the dashed missed approach line.
You can see a fix (HULIX) plotted at the changeover point, which is defined by DME. This point is the MAP for this approach.
So, to fly this approach correctly, you’ll descend following the step-down altitudes at all the fixes and level off at your MDA.
You can also see the approach path line straightened out on this chart.
Then, keep flying level till your DME shows you 5.9 nautical miles from CHE. At this point, execute a missed approach if you don’t see the runway.
Missed Approach Icons
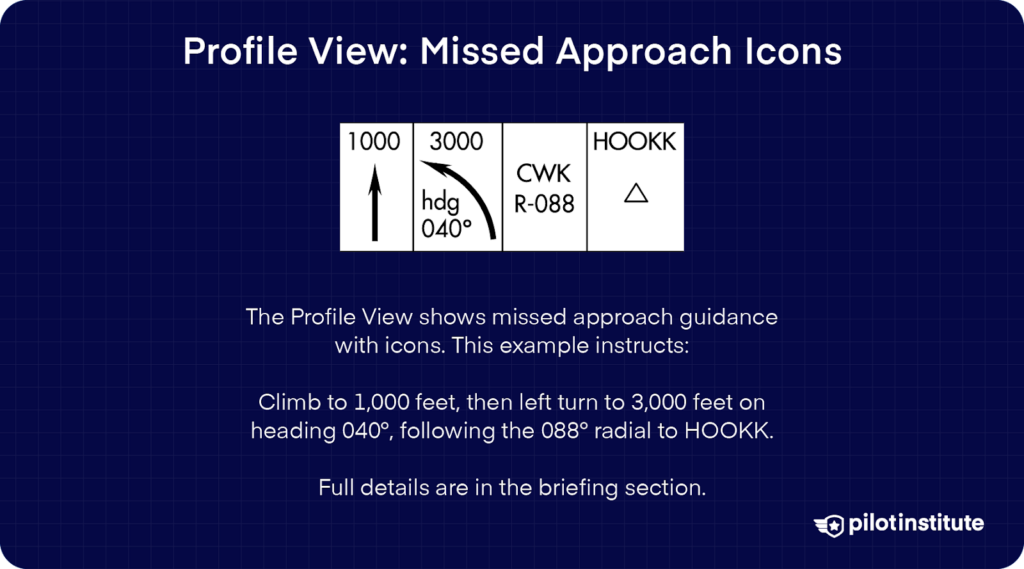
As in both previous sections, the profile view also provides guidance for implementing the missed approach. Here, the instructions are laid out in an inset as icons.
While the full-text instructions are written up in the briefing section, you can learn to interpret these icons with some practice. This example states:
Climb to 1000 feet, then make a climbing left turn to 3,000 feet to a heading of 040 degrees. Fly on the 088 radial from the CWK NAVAID till you reach the intersection HOOKK.
This view may sometimes only provide the initial directions for the missed approach. For the full procedure, look back at the briefing section.
Understanding the Minimums Section
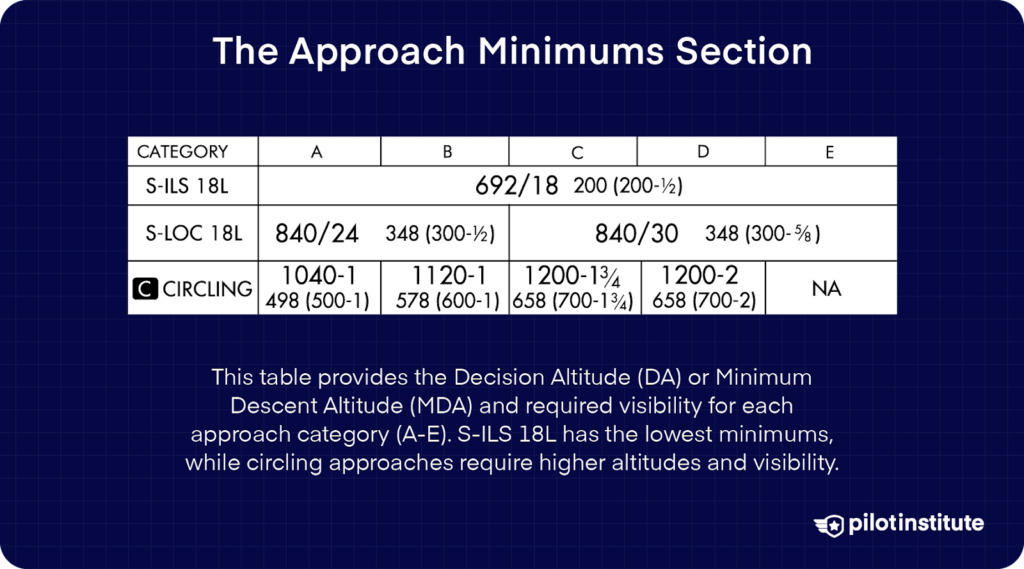
The previous section mentioned descending to the DA or MDA but didn’t specify those altitudes for this approach.
The minima table is where you find out not just the minimum altitudes, but also the minimum visibility requirements for the approach.
Let’s break down the data in the table.
Aircraft Categories
The columns in the minima table represent aircraft categories.
The table divides aircraft into categories based on their approach speed, specifically Vref.
Slower moving aircraft have a reduced turning radius and lowered minima. Category A, for example, includes aircraft such as the Cessna 172 or the Piper PA-28.
Approach Types
Different approaches have different minima depending on the kind of guidance they offer and their accuracy.
- Precision approaches such as ILS have the lowest minima.
- Non-precision approaches, such as the localizer approach in the table above, have slightly higher minima.
- Circling approaches require you to maintain visual contact with the airport as you circle around to land. That’s why they generally have the highest minima compared to other instrument approaches.
Understanding Landing Minima
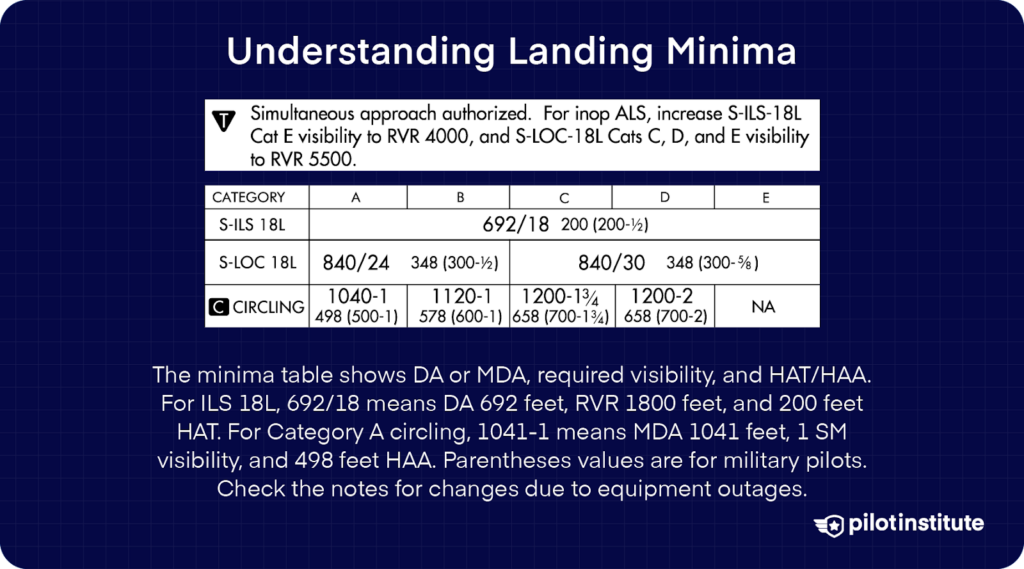
Let’s take a minima from the table above as an example.
- The minima for the 18L ILS approach is 692/18 200 (200 – ½)
- The first number, 692 feet, is the DA.
- 18 is the visibility (RVR in hundreds of feet). That means an RVR of 1800 feet.
- 200 feet is the HAT. This stands for Height Above Touchdown Elevation.
The HAT tells you you’ll be 200 feet above the runway when you decide whether to continue the approach or go around.
Let’s consider another example from the table.
- The circling minima for Category A is 1041-1 498 (500-1)
- The first number, 1041 feet, is the MDA (since circling approaches are non-precision).
- The second number, 1, is the required visibility in statute miles.
- 498 is the HAA or Height Above Airport.
You might wonder why we haven’t considered the numbers in the parenthesis. Those numbers aren’t applicable to civil pilots. They’re for military pilots who have their own regulations.
Remember, minima in this section can become invalid if the situation meets one of the conditions mentioned in the notes section on the briefing strip.
So, for example, if the approach lighting system is out, you’ll have to follow the visibility limits written in the notes.
Understanding the Airport Sketch
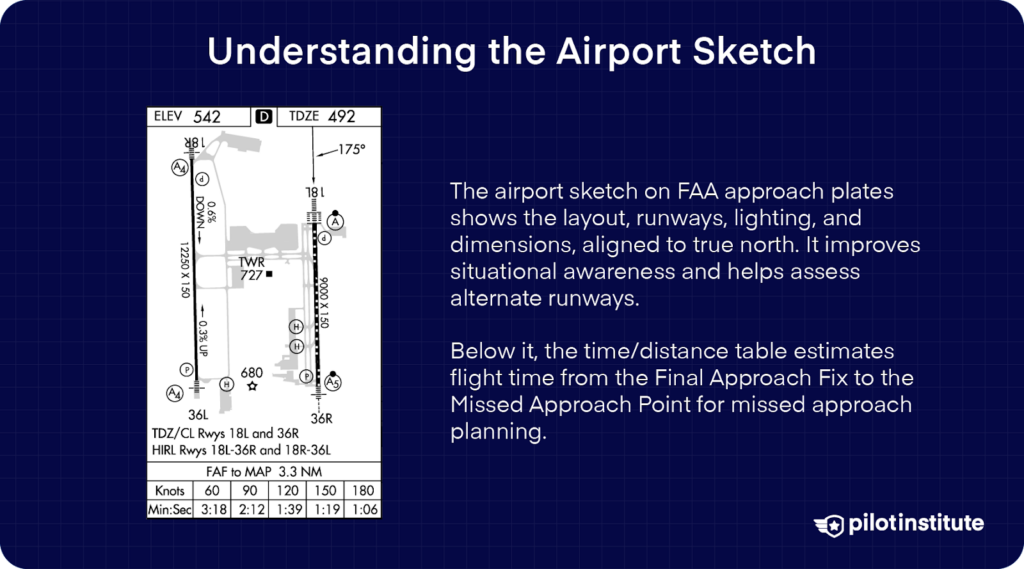
FAA approach plates include an airport sketch showing the airport layout and runway pattern. The sketch is aligned to true north. You’ll find it on the lower left or right of the approach plate.
The main benefit of the airport sketch is that it increases your situational awareness. This allows you to consider other runways if they are better suited to your approach.
You can also consider them backups in an emergency. Each runway has its dimensions labeled alongside it so you can judge if it’s appropriate for your aircraft.
The sketch includes the lighting pattern for each runway to make identification easier.
Time/Distance Table
The bottom of the sketch includes a time/distance table.
This lets you estimate how long it’ll take to fly depending on your speed, from the Final Approach Fix to the Missed Approach Point.
It’s another tool to help you prepare for a missed approach.
Conclusion
Once you learn how to read IFR approach charts it transforms them from intimidating diagrams into indispensable tools. Try familiarizing yourself with each section—the briefing strip, plan view, profile view, and landing minimums.
Remember, these charts are designed to guide you through every phase of your approach, so that you have the information you need. Eventually, interpreting these charts will become second nature.
If you would like to learn more about IFR approaches, check out our course on aircraft instruments. We also recommend reviewing documentation provided by the FAA on instrument approaches.